

Climate Action 

Climate change is one of the greatest existential threats the world has ever faced. At UTS we are working to decarbonise as rapidly as possible in line with our values. At UTS we are working to decarbonise as rapidly as possible in line with our values. We are taking action by reducing emissions across our operations, embedding climate considerations into teaching, advancing solutions and supporting climate resilience through research and extending our impact through partnerships and community engagement.  

Our Climate Positive Plan guides our response to the climate emergency, the Paris Agreement and our commitment to the UN Sustainable Development Goals (SDGs). Together, these commitments help drive the transition to a low-carbon, climate-resilient future. 

The UTS commitment

UTS is committed to achieving net zero emissions and becoming Climate Positive by 2029. Climate Positive means going beyond net zero by removing more carbon dioxide from the atmosphere than is emitted, creating a positive benefit for the global climate. 

As part of this commitment, UTS has already achieved key milestones including moving university investments to a fossil fuel-free fund and matching all electricity consumption with renewable energy. Our long-term focus is on reducing emissions as much as possible before addressing unavoidable emissions through sequestration and other offset measures.  

UTS is walking the talk, the first Australian university to commit to Climate Positive by 2029. 
Andrew Parfitt, UTS Vice-Chancellor and President, standing in front of a large blue digital display featuring abstract network graphics.

UTS action on climate change

UTS action on climate change transcript

Andrew Parfitt, Vice-Chancellor and President

At UTS we are taking action on climate change. In 2019 we were the first Australian university to sign the climate emergency declaration. In 2021 we achieved our 30 per cent greenhouse gas reduction target from the 2007 baseline. UTS is committed to the United Nations Sustainable Development Goals, and a signatory to Race to Zero, a global initiative providing leadership on the path to net zero and climate repair. We shifted the university’s investments to a fossil-free fund in 2022, and launched the UTS Climate Positive Plan, charting the path for our own decarbonisation journey to Climate Positive by 2029.

Universities have a vital role to play in how society responds and adapts to climate change and I am especially proud of the contribution being made by our researchers. From developing world-leading energy solutions with new battery technology, to smart inverters for renewable energy grids. From our marine scientists working to improve coral resilience on the Great Barrier Reef, to our focus on social justice, helping ensure that equity and fairness are at the centre of climate change adaptation.

Our students too, make a significant contribution. Their generation will be more impacted by climate change and their passion, energy and ideas help propel efforts across the university. I encourage you to take a look at the UTS4Climate website showcasing the activities of UTS staff and students.

The UTS pathway to net zero and beyond will help achieve the necessary and just transition to a low carbon renewable economy. The tertiary education sector has a vital role to play as an actor of change, developing innovative solutions, showcasing leadership, and equipping our graduates with the tools to contribute to positive change. Investment now in action-oriented research and skills development are an investment in the future.

Climate Positive Plan 

The UTS Climate Positive Plan provides the framework for the university's response to the climate emergency and charts our pathway to net zero and Climate Positive by 2029. Climate Positive refers to going beyond net zero carbon emissions by removing additional carbon dioxide from the atmosphere, creating an environmental benefit and moving towards climate repair. 
 
This diagram shows the key initiatives and commitments. 
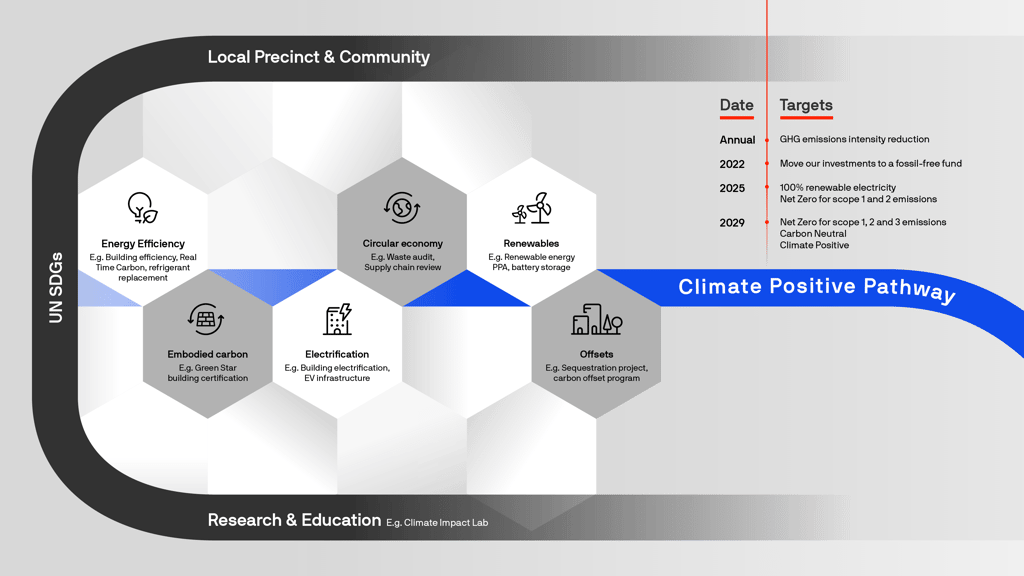
Diagram showing key parts of the UTS Climate Positive Plan

Key themes

Informed by the RACE for 2030’s Green Wave research project, the pathway towards Climate Positive consists of six key themes, with targeted initiatives that will enable us to decarbonise as rapidly and cost-effectively as possible. 

These themes are: 

  • energy efficiency – HVAC tuning, LED lighting, demand management, real-time carbon accounting, chiller/refrigerant replacement 
  • electrification – building electrification, EV infrastructure 
    renewable energy – renewable energy partnerships, battery storage 
  • embodied carbon – Green Star building certification 
  • circular economy – waste audits, supply chain review
  • offsets – sequestration projects, carbon offset program 

These themes guide decisions across campus operations, buildings, procurement, investments, research and community engagement.  

UTS’s climate action extends beyond operational emissions, harnessing and strengthening our research and education, extending our boundaries of influence to our local precinct and community, and reframing net zero through a social impact lens to integrate our delivery of the UN SDGs. 

We have now achieved two of our Climate Positive Plan targets: all our electricity is now matched with renewable energy, and we moved our investments to a fossil fuel-free fund in 2022. We are now working towards achieving net zero (for scope 1 & 2 emissions) and climate positive by 2029.  

Benefits 

The UTS Climate Positive Plan will deliver the following benefits: 

  • urgently address climate change 
  • demonstrate leadership 
  • meet our Climate Emergency Declaration and UN SDGs commitments 
  • achieve financial savings by capitalising on already adopted smart technology whilst continuing to invest in innovative energy cost-saving solutions 
  • leverage innovative initiatives for research, and teaching and learning 
  • future-proof campus infrastructure 
  • leverage our experience for others to encourage a green economic recovery 
  • help fulfil community, industry, and government expectations. 

UTS is a founding member of the City of Sydney's Better Buildings Partnership and an active member of the Climate Positive Working Group. 

The climate wars are over. It’s now time to develop practical, innovative solutions and UTS is leading the way. 

UTS Climate Positive Plan summary brochure (PDF, 956kb) 

Climate Action Plan shared with City of Sydney 

UTS was a founding member of the Better Buildings Partnership, established in 2011. The BBP is a leading collaboration of property owners, managers and key influencers that plays a key role in improving the performance and sustainability of existing buildings in the City of Sydney local government area and across Australia. UTS is represented on the Leadership Panel, and Climate Positive (Deputy Chair), Community Resilience and Sustainable Value Chains Working Groups. UTS's Climate Action Plan was shared with the Climate Positive Working Group which aims to deliver zero-emissions-ready buildings that support climate change mitigation, adaptation, and nature repair. 

UTS and the City of Sydney Council have a Memorandum of Understanding and hold quarterly Steering Committee meetings to collaborate on strategic areas including precincts and placemaking, sustainability and climate action, economic activation, inclusiveness, and education and research. 

Reducing emissions across our operations 

Reducing emissions is our first priority. UTS is implementing initiatives that lower energy demand, electrify campus infrastructure, increase renewable energy use and reduce embodied carbon in buildings and construction projects. 

Key initiatives include: 

  • Building efficiency upgrades and optimisation 
  • LED lighting and smart energy management systems 
  • Building electrification and electric vehicle infrastructure 
  • Renewable energy procurement and on-site solar generation 
  • Green Star-certified buildings and embodied carbon reduction measures 
  • Circular economy programs that reduce waste and emissions across supply chains 

These initiatives support our targets of net zero Scope 1 and 2 emissions and net zero Scope 1, 2 and 3 emissions by 2029.  

Responsible investment and divestment 

UTS recognises that investment decisions are an important part of its climate response.

In 2022, UTS moved its investments into a fossil fuel-free fund. The UTS Sustainability Strategy also commits the university to ensuring its funds are responsibly invested and that donors are aligned with university values. 

Learn about responsible investment at UTS 

Education for climate solutions 

Universities play an important role in preparing current and future leaders to respond to climate challenges. UTS integrates climate action across teaching, learning and research to equip students with the knowledge and skills needed for a rapidly changing world. 

The Climate Positive Plan recognises research and education as critical drivers of change. Through our curriculum, experiential learning opportunities and world-leading research, UTS helps students, researchers and partners develop practical solutions for climate mitigation, adaptation and resilience 

Through UTS initiatives such as Global Goals Month, Net Zero Futures, and as a major venue host for Climate Action Week Sydney, UTS engages students, staff and the wider community in conversations about climate change, helping build awareness, knowledge and capacity to support climate action. 

Program Spotlight: Net Zero Pathways 

Achieving net zero emissions requires collaboration across governments, industry, researchers and communities. As part of Global Goals Month 2025, UTS hosted a public webinar exploring pathways to net zero and the practical actions needed to accelerate the transition to a low-carbon future. The session was presented by ISF’s global energy expert Professor Sven Teske and looks at the role of research in supporting climate action.

By sharing evidence-based insights and real-world examples, the webinar assists our understanding of climate solutions and supports broader community engagement with the transition to a net zero economy. 

Watch: Chats for the Goals – Net-Zero Pathways
UTS “Chats for the Goals” graphic titled “Net-Zero Pathways”, featuring an aerial view of clouds and the Earth’s atmosphere against a blue background.

Thanks for having me. And, just for my background, I'm an engineer by training and I specialised on energy scenarios about 30 years ago
and I have the privilege now to review my own scenarios I actually did 30 years ago 
and see what happened and what went wrong. So in this presentation, I will give you a quick overview
what we do at the here at UTS, at Institute for the Sustainable Futures, basically the ISF, we are in
Building 10 and we are sort of a scientific consultancy. So we work mainly for
philanthropic organisations, for NGOs, for the United Nations.
So we do a lot of international work. So my, my personal background is, as you probably hear from my accent,
I'm originally German, came to Australia 10 years ago almost exactly and leading the international work.
So the background of what we do is we would like to remain
in a specific carbon budget in order to implement the Paris Climate Agreement to reduce greenhouse gas emission and phase them out entirely.
So what we do is not a prognosis, it's what if analysis basically
back casting we, we set a target and then say what do we need to do in order to achieve it?
So the Paris
Climate Agreement, which came into force or basically was agreed exactly 10 years ago in December 2015 in Paris,
set the goal that we want to remain under 2°, possibly 1.5°
global warming, average global warming compared to before industrialisation.
So we are currently, last year, we were the first time actually above 1.5 that that doesn't mean that we are always under over 1.5.
So we can actually go up and down a little bit, but it's not a very specific carbon budget
because it adds a lot of additional things to it. It's not just the energy, which is sort of 75% of it,
but you also have other greenhouse gas emissions, deforestation, reforestation, agriculture is obviously very important, land use also chemicals.
CFCs, for example, have a very high global warming potential. So we try to achieve an
a budget of between 400 and 450 giga tonnes until we reach total decarbonisation.
That is a table from the Assessment Report 6 from the International Panel
of Climate Change that has been published 3 years ago and they define a budget 500 gigatons has a 50% likelihood
of achieving 1.5° and a
67% of 1.7. So it's not that it's this budget exactly has this temperature,
it depends a bit on the circumstances and also the likelihood unfortunately.
And this is the idea of this graph, we are already out of the 100% chance to get to achieve it,
so we have only like a 50-60% chance to achieve it. Why do we still talking about 1.5° scenarios
for us and we had those actually this morning with a team. We would like to stay
to remain on 1.5 degree scenario term because it has a huge political impact.
So sustainable development goals, all those goals have the target to remain around 1.5.
If we say from the scientific community, it's too late, we sent a signal we don't want.
To be perfectly honest, we need to decarbonize as, as fast as possible.
And if we end up with 1.5, 1.6, or 1.7, time will tell.
But what we really need to do is we need to decarbonize. And that's the important thing. So we are here, I think, a very interesting debate
between science and politics. Yeah. So we we are here right now.
In terms of the methodology, we have four main pillars. Actually, we've developed a fifth right now or a six, five and six.
One is we do in GIS based a solar and wind potential analysis.
So we basically look at the the map and then we subtract we as we,
we take out national parks, nature conservation areas,
urban areas and, and stuff where they say, OK, we can't build, for example, wind turbines there.
You won't build a wind turbine in the middle of the city. So we take out all this, then we,
overlay, sort of wind data, in five by five kilometre blocks.
We use the data from ETH from Zurich, the university in Zurich.
They have a global database for every 5 kilometres for the last 10-15 years of wind and solar
and in one hour resolution. So we basically calculate what is the potential for solar
and wind for each country in order to make sure that when we develop an energy scenario, we won't use more solar
or wind power than the country can actually install. We always have the, the situation
that we'll come to that a bit later that we have plenty. There are a few countries where we have actually a limit
for one of the, one of the countries we did where we had a limit where we could do 100% renewables, but it was really close.
It was Bangladesh because, the, the, the land area and the density of the population and also the really bad wind speed
there, didn't really allow so much wind. So we had to rely almost entirely on solar.
So then we do an analysis after we develop an energy scenario
in what is the impact of a 5 or 7 year delay?
And then this is, currently under development. We want to connect our scenario with a Montreal Kunming,
A biodiversity convention, which means there is a target of
having 30% protected areas, biodiversity protected areas globally by 2030.
Currently, we have 18%. So we would like to, to,
connect the biodiversity model with our energy model, which is not really easy, and we're still not there.
And then we break down our energy scenario into what's called GICS classes,
which is a global industry categorisation standard. And that is, basically it has been implemented
after the global financial crisis, in order to classify all the different investment streams, in order to track them better.
the sustainable finance for the global finance industry, they use this system.
For example, they have, if you're a portfolio manager, you're managing two $10 billion and you have 1 billion of, of GICS
class 15-O20, everyone knows 15 O 20 is the steel industry.
And you have basically you need to target for the steel industry right now. And what's the emission of the steel industry in 20 years?
This is what we do. So we break that down. We have, in our, in our model,
we modelled, all the G20 countries, plus or the EU member states.
And we also start working for least developed countries
to basically help with electrification and energy access plans where we use the same model,
but we basically use the output a bit differently, also the input. So we did this for Tunisia, Senegal,
Malawi, Kenya, Tanzania and Rwanda. I'm particularly proud as one of the results
of our, of our work, I will get a PhD student from Rwanda,
at beginning of next year who learns modelling, and that's his PhD about energy modelling for Africa.
And I'm particularly proud of that. Then we have, the demand side.
So we basically structure a country into 20 different sectors.
And then we have all the different, energy services, primary and secondary.
Primary energy is basically, for example, sun is primary energy, oil is primary and secondary is you turn sun into electricity
or oil into heat, for example. So that is sort of what we do.And then we have different,
we have different datas, we have the market development, how different technologies, how different services develop
and then the different emission factors and energy intensities don't need to go through all of these different things is also published.
But this is basically what we do for as a data provider for the finance industry.
So we are currently negotiating another contract with a data provider and database in the UK and they basically provide
this service, the starter service to the finance industry and they basically get the money by selling that.
So we provide the data and
we have, we do we what I'd already said, we developed the new methodology for the biodiversity framework.
We I can't present that now because it's, it's still, work in progress.
And what we start doing is we remodel the International Energy Agency scenarios.
And the reason for that is the IEA, the International Energy Agency, has no mandate to do country scenarios.
So they quite often have, only global scenario. So for example, have a net zero global scenario, but they are not allowed
by their mandate to break that down to country level.
The finance institutions, they like to use the International Energy Agency data in net hours.
I mean, you know, we are not the International Energy Agency. So, what we what they ask us to do
is you break down the global scenario from the IEA to a country scenario, and that's basically what we do.
And that's not easy because the IEA is not really generous with information.
So there is always something missing. If you try to remodel there's always something missing, but you have to guess.
Okay, goodnight. So the solar and wind analysis is very, very, short and sharp.
What I already said we have land cover maps, we have, we subtract also slopes.
So for example, you can't, you won't build a wind turbine in the sort of mountain range
you have protected areas and there's also a wind speed. If you're under, like, say, five meters per second, average
wind speed, you wouldn't build a wind turbine there. It's not good enough. There are not too many areas on the worldwide
where you have under 5, but usually the tropical sort of around the equator you have either no wind or too much.
So it's not really good, equator, it's not too good for wind, for wind energy. There are exceptions.
But, a sort of a rule of thumb in the tropics, wind is not the first source for renewables.
And we do this, the same also for, for solar. But solar is a bit more flexible.
The reason why we do both and not sort of just focus on solar is, is that you usually have wind
when there is no sun and you have quite often sun when there's no wind. So you basically save batteries.
Secondly, we also include offshore wind because you have quite often offshore wind, blowing when onshore.
There is not much going on. And for Australia, there is a specific, purpose.
Australia obviously has enough landmass. We don't really need to go offshore, but we don't actually have a big strong grid.
But, if you build offshore wind off the coast, you can actually use the infrastructure from the coal industry.
So if you build off the coast of Newcastle, you just use the interconnector
in Newcastle, you're basically just coming from the other side. You're not coming from land, you're coming from the sea.
And that actually saves you a lot of grid expansion, where you basically have really good wind areas,
but there is there's no cable, nowhere near. So we have those maps and those maps are all online
you can download, you can zoom in by 5 by 5 kilometres. And basically, what we also do for that is for wind.
We have then this is one of the output. This is currently the, the final electricity demand from, from the EU 27.
That is the onshore wind potential and that's the solar potential. So we really don't have any problems.
So usually as a rule of thumb, most countries need to utilise roughly 5% or less of their solar
and wind potential to supply them entirely. So that's pretty good.
Australia is in the extreme. Australia, the demand is here. That's the line here.
So we have plenty. We don't need that. I mean, that's, I mean, for Australia,
that's sort of a no brainer. But for some other countries, as I said, it is not always that easy.
And also the smaller the country, the more difficult it gets because you need to be more specific.
So for example, if you would we we have never done that, but if we would, develop an energy scenario for Singapore,
that would be complicated because Singapore is basically just a city. So what would you do?
I'm not sure if Singapore could do it, just on their own territory.
Luxembourg. I've done Luxembourg. Just, I mean, it's really small.
Luxembourg is smaller than the average Australian farm. So it's really,
So we have, basically a comparison, and we basically provide all the data for, for our,
scenarios also, for discussions. So, you know, the discussion about,
do we need wind to be and how much and stuff like that. So this is also to inform the wider community to, to,
to develop the concepts. And we also try to make a have a whole range
of different technologies. So I'm aiming to get funding to, do more like this, for biomass.
In some regions, biomass would be a very good option, but it has a huge competition with sustainable,
sort of bio, biodiversity, with food, with, there's so many, competition.
Also, if you have biomass, would you use it for energy or would you rather use it
for feedstock like for feedstock for the chemical industry? So you can't only use it, you can only use it once.
So that's so those maps are all available.
We have done the very detailed one also for Nepal, forgot that, we have done, joint project with Nepal for one and a half years.
It's actually one of the very few where we got a prize for, that a few years ago.
So we did a very long, detailed work. And this is basically Australia, with and we say what, the,
square kilometres, and what, how many gigawatts you can install. And I'm not sure if we, skip that.
Anyway, I go to back, we have one more one other scenario in this.
And then we, we basically subtract the entire region, which is more further away than ten kilometres from a grid,
and then you come down with your, with your, potential quite a lot,
but you still have enough in most cases. So that's basically more the realistic approach where you,
you wouldn't actually build a solar farm right here when there's nobody anywhere near that doesn't make sense.
So basically this is the, the, the first part of the work. I skip that and then we have,
the, the next part is, a fair distribution of, carbon budgets,
carbon emissions So who is allowed to emit in the future? So what we do is we have first the carbon budget like say here
USEU, India, China, Australia, G20 in general for the cement industry, for the steel
industry, chemical industry and so on. So that's the total budget, the carbon budget
that this country has for that industry. And we add this up, then we need to add it up and say,
OK, are we still within the 450 giga tonnes of CO2 globally?
And in the second step, we look at historical data and say, OK, what was the emission between
the beginning of the documentation of the CO2 missions usually around 1850 and today and 2019, Sorry,
because we start with our projection 2020 until 2050.
Then we have the carbon budget from the beginning, to the, for, of, of the industrialisation to the, sort of, decarbonisation
that is a carbon budget. We divide it by, with, the population in the country right now.
It's just an indicator. It's not just that the cap per capita, it's an indicator
and that gives you then, a graph. So it basically this point is the, the carbon capital,
the per capita carbon indicator in terms of what is the current
indicator for the carbon emission for a country.
And we look at the, the average and for the global stock, tale
what's currently under discussion in the United Nations. The climate change program,
is basically, who gets what budget? We say, okay, everyone above that line needs to pay in, in a, fund,
and everyone below the line will get money for the energy transition. The further up you are, the more
you need to pay, the further down you are, the more you get, because what we can't negotiate is, the emission itself.
Because, frankly speaking, that sounds harsh. Harsh, a tonne emitted by 1 billion people
in a developing country or emitted by one very rich person?
For climate, it doesn't matter. It's just a carbon, a tonne of carbon.
So, therefore, we can't actually negotiate. Oh, you know, you can't emit more because you haven't done anything
that unfortunately doesn't work. We will trigger our climate in any case, because the climate is pretty brutal.
So we basically, try to develop this in order to distribute carbon budgets.
Fair based on current technologies, current, pathways, but then with the caveat
that we negotiate, not the emissions, but the, the, the finance.
And we basically also look at, what is the impact of delay for specific industries.
And you see buildings has a, has a huge impact. And road transport has a huge impact as well.
That means this is what we need to do first or not first. I mean, we need to do everything
at the same time, but, there are different lead times. So you can insulate buildings, you can turn and you can switch from,
let's say, fossil fuel powered heating in, in, in countries where you need heating, to electric heat pumps.
That's you can do that now. If you want to decarbonize the steel industry, you need to actually,
build up a total new manufacturing capacity. Everything that will take time.
Even if you start today, you will have no, no, change in the next 5 to 7 years.
There are, about 980 steel manufacturing plants in the world.
And only 4 to 5 companies who can actually deliver,
a decarbonized steel manufacturing, facility based on hydrogen.
So it's you can't just say tomorrow we just change. So this is why it gives us an indication where we need to start.
Interesting also with electric vehicles, which we prioritize for road transport.
The reason why we go for electric vehicles, not for hydrogen, is a very simple one.
The electric vehicles are more efficient. So if you have 100 kilowatt hours produced,
let's say from a wind turbine, you, you transmit that, you charge your battery,
and then you drive your vehicle with this 100 kilowatt, hours, you can drive around five, 450 to 500 kilowatt,
but the normal, average sized electric vehicle. If you have the
100 kilowatt hours electricity, you produce hydrogen, you lose already 50 kilowatt hours, because 50% loss with hydrogen.
Then you transport that you have another 10% loss. Then you have the conversion process,
in the combustion engine or in the fuel cell. Another loss. So what you, you end up with, with 100 kilowatt hours, you,
you drive 50 kilometres, not 500. So it's a very technical reason
why is, is that that still companies, promote hydrogen, few, cars.
It's pretty easy. First, the fossil fuel industry is very interested because it's still a fuel.
It's their business concept. If it's not fuel, if it's electricity is totally out of
their business concept, they are out of that. Secondly, a combustion engine
has the highest value when you, when you sell cars, is the, the engine.
So you are really interested in the engine, and you have more moving parts, you have more maintenance.
And if electric vehicles has about,
30-40% less moving parts, that means, if you are a car company, your income is actually
by service, not by selling the car in the first place. That's why they really don't, interested in electric vehicles.
Traditional. And as, my my German heritage. The German car industry hates electric vehicles
because, it's just because you can't earn enough money with it. And you will also need less people.
So it's about, you need about 30 to 40% less workers. So the German car industry has 1 million jobs.
So you will lose 250, 300,000 jobs if you if you change. So that's not a good look.
So it's, it's really difficult. And in the, in the practical terms to actually transit.
And then we have also, we broke down the budget into for the EU, countries.
And then you have the population share of a country from the EU, within the EU and the emission.
So it's not always a total fit, but it's sort of works. The reason why it's changed, for example, Poland has a very
high share of, coal while, Austria, for
example, has 60% hydropower. So that it's, it's like Sweden has almost
no CO2 emission with electricity generation because it is either hydrogen or nuclear.
And nuclear is replaced now with mainly wind. So that's why they have less emissions.
That's the breakdown, for the budget. But I just skipped that. And then finally I would just like to, not go through all the,
the details, but just to show you what we, what we sell, basically as, as a consultant, we sell the data.
We're saying, what is the, the chemical industry is in is, in the, example here, scope one.
What's the emission right now for a specific country? What will be in the future? Scope one is what you actually do in your own process.
And then we say also what scope two emissions is the oldest. Scope two emissions are the emissions caused by, if you buy a service,
it's like you buy electricity, that's scope two emissions. You don't really produce the emission yourself, but, you know, you buy it, you use it.
That's why you are also responsible. And then, scope three is,
the emissions caused by what, when you use the products. So, for example,
if you have a car, the car industry has a relatively small scope one. Scope two is also just the energy they need, but scope
three is the emissions, caused by using the car. And that's why it's quite high.
So we basically have that for all the different industry sectors. And I skip that.
And then finally, the, we have, we had a project last year where,
the European Community has, a taxonomy where they basically identify,
different measures for each industry, down to, the different classes.
We, we basically we start here with the main classes of the industry, but then they, they go further in subclasses.
So we try to break down the emissions and the energy demand for all the subclasses.
Where, where we, if you go further South than here, then you just have to
very thick rule of thumb. So it's not really detailed. But, the taxonomy identifies measures,
where you, basically, in line with the targets and therefore have
financial benefits or financial privileges, in the economy.
I could do a whole presentation just for the taxonomy. Australia actually develops also a taxonomy,
based quite much, quite, heavily based on the EU one. So that's why we actually were really keen on working on the EU
taxonomy in order to, to get into that topic. And then we basically, look at, the different measures.
What is, what is, sort of a climate service and energy service because they're all very detailed
explained what is the climate service in specific industry? And last but not least, they are,
taxonomy economic activities. And the economic activities, defined and also
then enable you for or you have targets to do those,
economic activities if you don't, you have to pay a penalty yourself. So that has an economic impact, when you, not apply
for the taxonomy, the that's the, the reason why it's, it's quite heavily discussed.
The problem is it's so super complicated, that, a lot of people A, don't understand it.
And B, even the, the, the industry is basically set up. It's too complicated with "Tell me, how much fine do we need to pay?"
So that's I think it's a really good example of how not to do a policy.
If it's too complicated, no one understands it. And, I just skip that because we don't have time for that.
What I want to, show you is what, what we have public, publicly available.
And I think I'm sort of in the, in the time. So we have what we do is, we work with clients,
and we are, quite successful of telling them that if we publish a journal paper, it's influential.
So we try to convince them we don't want to have just a normal report. We say, okay, a journal paper is better as we work
with a lot of NGOs and also with, like international governments. It's an international organization that actually works.
And for, my team, it's a motivation because if you don't have publications, you can't apply for promotion.
So, you know, that's a no brainer. So everyone wants to write a paper. So that's what we do.
So we did the EU paper that was the last one last year. And then we have our one Earth
Climate Model website here on UTS website. And you can basically click on, select the country,
you can select an industry. And then you see what's the emission, what is the energy. Demand and da da da.
So basically this is all work in progress. And whenever we have a new scenario, we just put that online
and then this is, all the, into the website, this is all what you can generate yourself.
You can generate the graphs and everything. So, for us, that's very important to communicate because at the end of the day,
there are a lot of, really good research. There's a lot of good research work out there,
but if you don't really communicate it, it's sort of a bit lost. There was,
it was a few years ago, there was a survey that, World Bank reports, the average World Bank reports
won't get more downloads than five. And there's probably four authors.
And the mother of the author. That's, so it's really frustrating.
I think there was 70% of the world Bank publication. Never, ever got a, download.
And they have really good data. We use a lot of the, probably one of the five. So it's frustrating.
But I think it's also a matter of communicating. Communicating is really important in order to reach your audience
and, to, yeah, to actually just get it out there.
So we have done all those countries. The green one that's, that's a slide is a few weeks old, and now we have, the yellow
and the green ones also, completed and published. So we are inching towards covering the entire world.
So I hope to have like 60-70 countries, published, and, and then also regular updates.
And I think that's, a very good, contribution as part of this work.
And I'm, I'm proud of that, to be honest. I was, nominated for the International Panel of Climate Change
as one of the lead authors for the upcoming Assessment Report 7, which starts in December and goes on for four years.
So it will be published in 29. And, that is sort of a guidance for,
for what can we do, into climate change. And, that's pretty much it.
I think. Hang on, that's wrong. Yeah. That's it.

Ways you can help UTS achieve Climate Positive 

Students

  • Join a student group like the EnviroCollective or SASS and participate in campaigns, protests, and fundraisers
  • Sign up to UTS SOUL, learn new skills and give back to the community
  • Participate in Green Week and Global Goals Month activities
  • Take sustainability-focused subjects
  • BYO cups and food containers
  • Travel to campus sustainably using public transport or active transport, like walking or cycling.

Academics

  • Incorporate the UN Sustainable Development Goals into your teaching
  • Undertake and promote research that has a positive impact on sustainable development and climate change
  • Consider the GHG emission impacts of your research work
  • Participate in campus events like Global Climate Change Week (Oct) and Global Goals Month (Sept)
  • Ensure lights and AV equipment are turned off before exiting teaching and research spaces
  • Shift your superannuation to fossil-free. Most funds, including UniSuper, offer fossil fuel free options. See example here
  • Attend international and interstate conferences virtually where possible.

Professional staff

  • Embed sustainability into your policies and procedures. 
  • Procure goods and services sustainably.
  • Pick up sustainability tips by listening to 2SER’s Think: Sustainability podcast
  • Shift your superannuation to fossil-free. Most funds, including UniSuper, offer fossil fuel free options. See example here
  • Take social justice leave and volunteer your time, skills and expertise to the community.

More information for UTS Staff

Access the full plan on SharePoint.