

The UTS Social Impact Dashboards collate data from across the spectrum of the university’s activities to measure our progress against the social justice goals outlined in the Social Impact Framework (SIF), and present it in a user-friendly format.

Dashboard preview
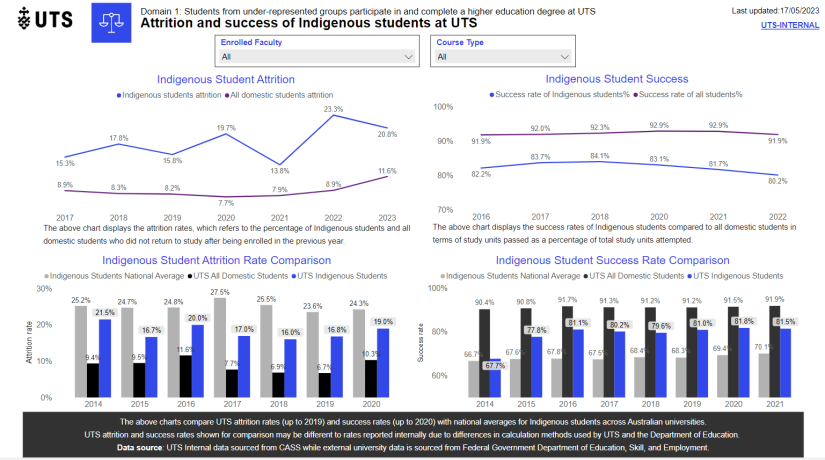
The dashboards use Power BI to translate aggregated data into accessible, interactive infographics that illuminate how we are tracking against our social impact goals.
The below data are samples taken from domains 1 (student access) and 6 (workforce diversity) of the Social Impact Framework.
Get in touch
To find out more about the dashboards, inquire about accessing them, or to partner with us, please email at SIF@uts.edu.au.
Find us on level 16, UTS Tower (Building 1),
15 Broadway, Ultimo NSW 2007, Australia.
The UTS Centre for Social Justice & Inclusion is a gateway for partners and communities to engage with the university's resources and expertise to maximise social impact.