- 11 October 2024
- 1 October 2024
- 1 October 2024
- 30 September 2024
- 20 September 2024
- 20 September 2024
- 22 August 2024
- 8 August 2024
- 2 August 2024
- 29 July 2024
- 16 July 2024
- 19 June 2024
- 8 May 2024
- 17 April 2024
- 5 April 2024
- 4 April 2024
- 28 March 2024
- 27 March 2024
- 21 March 2024
- 1 March 2024
- 1 March 2024
- 1 March 2024
- 5 February 2024
- 23 January 2024
- 16 January 2024
- 21 December 2023
- 17 November 2023
- 15 November 2023
- 1 November 2023
- 25 October 2023
An international team of scientists have made groundbreaking findings that describe five new-to-science species and rewrite the family tree of one of the world’s most iconic coral groups.
Before being confronted with the reality of a disaster, police and emergency services need to be prepared as well as they can be under realistic conditions, an important role for the University of Technology Sydney’s Australian Facility for Taphonomic Experimental Research, or AFTER.
Three UTS researchers have been named as finalists in the 2025 Australian Museum Eureka Prizes, the nation’s highest profile science awards.
New research suggests global warming is increasing the frequency and intensity of wind gusts from thunderstorm downbursts, with serious consequences for air travel.
Battery and energy storage pioneer Distinguished Professor Guoxiu Wang has been elected a fellow of the Australian Academy of Science.
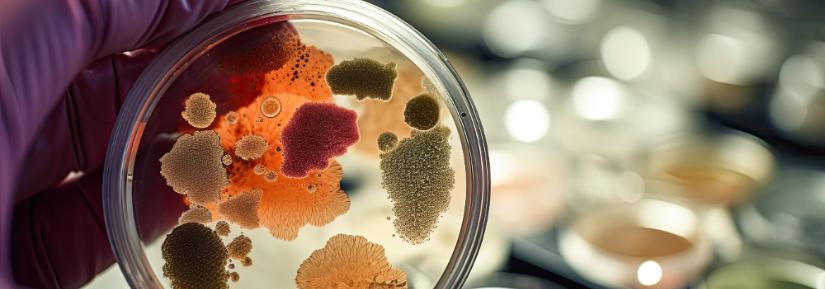
A harmful algal bloom of Karenia mikimotoi made dozens of surfers sick and killed seadragons, fish and octopuses on two South Australian beaches.
Marine scientists are calling for beachgoers who find weedy seadragons washed up on the shore to photograph them and send details to researchers at UTS.
As NASA prepares to send astronauts back to the moon for the first time in over 50 years, new research from the UTS has found that lunar dust is less harmful to human lung cells than previously feared, and significantly less toxic than common Earth-based air pollution.
Done well, the renewable energy transition should improve the lives of First Nations Australians.