


- Posted on 23 Oct 2025
By James Laurenceson, Elena Collinson, Wanning Sun, Marina Zhang and Xunpeng Shi
Executive Summary
Despite its limited resources and scale, Australia operates at the global frontier of knowledge creation in emerging technologies, including artificial intelligence (AI). Chinese nationals have played a fundamental role in making this possible. Among the world’s top AI researchers who earned a graduate qualification from an Australian institution, more than half were recruited from undergraduate programs in China. Anecdotally, in recent years this pipeline of talent appears to have encountered difficulties in securing entry visas.
To provide an empirical basis for understanding these experiences, analysts at the Australia-China Relations Institute at the University of Technology Sydney (UTS:ACRI) conducted a survey between August 28 and September 19 2025, targeting Chinese nationals who had applied, or were applying, for postgraduate study or research-related visas in Australia. A total of 371 valid responses were collected through academic and professional networks. As a non-probability convenience sample, the results are indicative rather than representative but nonetheless provide timely insights into applicants’ experiences.
Key findings:
- Academic and visa profile: Respondents were predominantly from STEM fields, particularly Engineering and Technology (66 percent), followed by Fundamental Sciences (12 percent) and Life and Medical Sciences (12 percent). Most sought entry as PhD candidates (57 percent) or visiting scholars (24 percent), applying primarily under the Student visa (subclass 500; 60 percent) or Temporary Activity visa (subclass 408; 39 percent).
- Funding: Funding for respondents’ study or research in Australia was largely institutional, led by the China Scholarship Council (42 percent) and Australian host universities (38 percent), underscoring the structured nature of bilateral research mobility. Self-funded applicants accounted for a small minority (seven percent).
- Institutional affiliations: Prior study in China was concentrated in major research-focused universities such as the Chinese Academy of Sciences system (nine percent), Zhejiang University (five percent) and the University of Science and Technology of China (five percent). Intended Australian destinations were concentrated among large metropolitan universities – University of Technology Sydney (13 percent), University of Queensland (12 percent), University of New South Wales (10 percent), University of Sydney (eight percent) and RMIT (six percent), collectively accounting for nearly half of all stated preferences. (Note: The relatively high proportion of UTS applicants may reflect the greater involvement of UTS academics in distributing the survey through their professional networks).
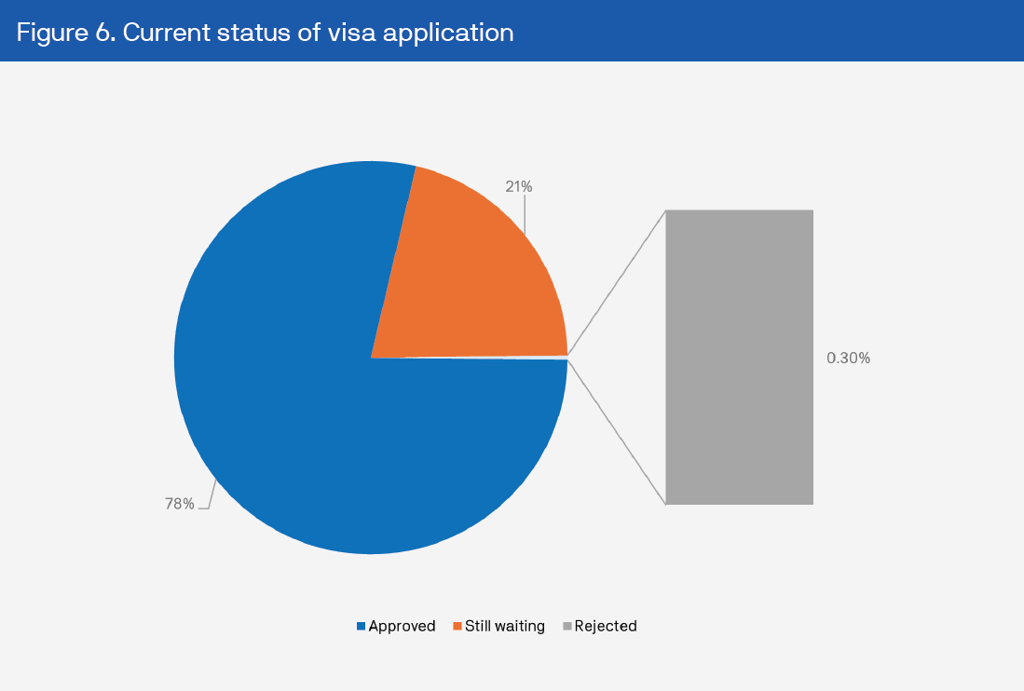
- Application outcomes: At the time of the survey, 78 percent of respondents were still awaiting a decision, 21 percent had received approval and one respondent (0.3 percent) reported rejection.
- Processing duration: Among approved cases, the median processing time was six months (mean seven months) with about one in six reporting waits exceeding one year. Pending applicants had already been waiting a median of six months (mean 6.4 months) suggesting that processing durations were lengthening for a subset of cases and likely to extend further before resolution.
- Visa subclass comparison: Processing times differed between visa types. Among approved applications, the Student visa (subclass 500) showed a median of nine months, compared with four months for the Temporary Activity visa (subclass 408). For pending cases, the pattern reversed. Temporary Activity visa applicants reported longer median waits (eight months) than Student visa applicants (4.5 months).
- Comparison with Department of Home Affairs indicative processing times: Relative to Home Affairs’ published indicative durations, median processing times reported in the survey generally fell near or beyond the Department’s 90th-percentile range. This indicates that while many applications were completed within the range typically observed across all applicants, a significant subset, particularly among pending cases, had already exceeded these indicative durations, reflecting more variable processing experiences within this group.
- Disciplinary variation: Applicants in Engineering and Technology fields (66 percent of respondents; median processing time = 8.5 months) reported the longest waits, followed by those in the Fundamental Sciences (12 percent; 7.5-8.5 months). Applicants in Life and Medical Sciences (12 percent; five months) fell in the mid-range, while those in Humanities, Social Sciences and Business-related disciplines (10 percent combined; 0.5-3.5 months) reported shorter durations. These differences may reflect variation in application volumes or administrative assessment processes; however, the survey does not provide evidence of causal factors.
- Perceived impacts: Eighty-four percent of respondents indicated that visa processing times had a significant impact on their study or research plans. The most common effects were delayed commencement (59 percent), personal or family disruption (16 percent) and missed academic or work opportunities (11 percent).
- Alternative destinations: Around 60 percent reported considering study or research in other countries due to the duration of visa processing times, although most ultimately planned to proceed with Australia.
- Perceived factors influencing processing durations: Respondents most frequently attributed processing durations to policy or bilateral relationship factors (73 percent) and security or background checks (53 percent), with administrative workload (32 percent) and documentation issues (nine percent) cited less often. Overall, applicants tended to interpret the duration of visa processing times through a geopolitical rather than procedural lens.
- Qualitative feedback: Open-ended comments reinforced these perceptions. The majority referred to extended waiting periods and limited communication, while smaller subsets cited fairness concerns or proposed administrative improvements, such as clearer communication protocols, enhanced progress tracking, or the introduction of a dedicated researcher visa stream.
The survey did not include applicants from other national backgrounds. The findings should therefore not be interpreted as unique to Chinese nationals; similar experiences may occur within the broader international research applicant cohort.
Overall, the results indicate a consistent pattern of variable processing durations and limited communication during the visa process. These findings highlight the value of continued transparency in processing benchmarks and clear communication of procedural expectations for applicants engaged in research-related mobility.
Read the full report (PDF, 3.3MB)
1. Introduction
In the fundamental research that underpins emerging technologies, Australia has not only kept pace with but has also helped drive developments at the global frontier, despite limited resources and comparatively small scale. This performance largely reflects policy frameworks that have supported open and international research engagement.
Consider the case of artificial intelligence (AI). In the field of Computer Science – Artificial Intelligence, between 2020 and 2024, researchers affiliated with Australian institutions appeared in 3,918 peer-reviewed publications ranked among the top 10 percent of most-cited publications globally.1 While this output was lower than that of major research economies such as the People’s Republic of China (PRC) (30,343) and the US (19,654), only the UK (4,980) and Germany (4,363) ranked higher than Australia. A defining feature of this performance was the high level of international collaborations. More than four in five Australian top-tier publications involved at least one overseas co-author. In contrast, the corresponding share was below two in five for the PRC, and below one in two for the US. Researchers affiliated with Chinese institutions appeared on half of Australia’s top-tier publications, while US collaborators appeared on one in eight.
However, publication output represents a lagging indicator of research-system performance. To understand the sustainability of Australia’s knowledge-creation capacity, it is necessary to examine inputs, particularly the inflow of human capital. International mobility of researchers and students is a vital component of this input base. Students and researchers from abroad contribute directly to research productivity and to the viability of domestic research teams. Restrictions on their recruitment can reduce incentives for research leaders to maintain laboratories within Australian institutions.
In AI, these international linkages are especially evident. As of 2023, among elite AI researchers who earned their graduate qualification (e.g., a PhD) from an Australian institution, only one in eight were recruited from a domestic undergraduate program.2 More than half (56 percent) earned their undergraduate qualification from a PRC institution, making the PRC by far the largest external source of undergraduate talent, followed by India (fewer than one in 10).
A majority of this talent remains in Australia: of top AI researchers performing post-graduate work in Australia, seven in 10 earned their graduate qualification domestically, while about 15 percent were trained in the PRC. The UK was the second most significant international source, accounting for around five percent of Australia’s postgraduate research workforce.
Of course, international engagement also introduces security and governance risks. The Australian Security Intelligence Organisation (ASIO) has stated that it was ‘aware of researchers and their families who have been threatened, coerced or intimidated by actors seeking to have their sensitive research provided to a foreign state’, as well as universities that had been ‘threatened through financial coercion should critical research continue’. ASIO further emphasised that Australia cannot afford to leave such ‘harmful foreign interference unchecked’, while also noting that ‘having effective mechanisms in place to counter foreign interference and espionage does not need to come at the expense of the openness and international collaboration that is a hallmark of the higher education and research sector’.3
Tension arises when policy measures aimed at preventing foreign interference have, if not the intent, the practical effect of discouraging legitimate collaboration. A recent independent review of Australia’s Foreign Relations (State and Territory Arrangements) Act 2020, for example, recorded some stakeholders reporting ‘a chilling effect on research and overseas engagement and was seen as at odds with…the national interest’.4
Under the Act, certain agreements between Australian and foreign universities must be notified to the Department of Foreign Affairs and Trade (DFAT) if the foreign institution is assessed as lacking institutional autonomy. DFAT’s Guidance on Institutional Autonomy outlines indicators for this assessment, including whether a university’s governance, teaching or research is legally required to align with the political doctrines of a ruling party or government.5
While the guidance does not identify specific countries or create a blanket presumption, the PRC’s Higher Education Law establishes a governance model in which universities operate under the overall leadership of Communist Party committees. The Patriotic Education Law, which took effect in 2024, reinforces this framework by requiring all higher education institutions to integrate patriotic education into teaching and research, and by mandating Party oversight of ideological content.
On this basis, universities within PRC jurisdiction are widely understood to fall within DFAT’s criteria for lacking institutional autonomy, meaning agreements with them are generally subject to departmental notification and potential ministerial review.
By contrast, universities in most other countries typically do not meet these conditions and are regarded as autonomous under DFAT’s framework, even though political pressures on university research or governance can arise episodically in any system.
When an institution is deemed to lack autonomy, any agreement with an Australian counterpart must be listed on a public register and may be varied or cancelled by the Foreign Minister, carrying potential administrative and reputational consequences for the institutions involved.
Some university administrators and researchers have expressed concern that, when combined with other initiatives such as the Universities Foreign Interference Taskforce, current policy settings may encourage over-cautious or inconsistent interpretations of compliance requirements in international engagement.6 In this view, the greater risk is not underestimating security concerns, but rather over-correction, where uncertainty or institutional caution leads researchers to avoid otherwise legitimate or beneficial collaborations.
There is some evidence that Australian researchers and institutions are avoiding collaborations with Chinese partners when submitting grant applications – another input into the knowledge creation endeavour – to the Australian Research Council believing that such partnerships could reduce the likelihood of grant success.7 There are also anecdotal reports of Chinese students seeking to enter Australian graduate programs experiencing extended visa delays and uncertainty, prompting some to consider alternative destinations.8
Against this background, visa processing emerges as one possible administrative factor influencing research mobility. Data published by the Australian government indicate that there is no formal restriction on visa issuance to Chinese students seeking entry into postgraduate research programs. Indeed, the number of visas granted to Chinese students is close to record highs.9 Grants in 2024-25 were up 58 percent on pre-pandemic numbers in 2018-19.10 However, these statistics do not disaggregate approvals by field of research. Anecdotal accounts suggest that delays and rejections are most common in Science, Technology, Engineering and Mathematics (STEM) fields like AI where collaboration with Chinese partners has become more politically sensitive.
This report analyses data collected through a survey conducted by analysts at the Australia-China Relations Institute at the University of Technology Sydney (UTS:ACRI) between August 28 and September 19 2025. The survey targeted Chinese students and scholars who had applied, or were in the process of applying, to undertake postgraduate study or other research-related activity in Australia. It was distributed through academic networks and used a convenience sampling approach (see Methodology). The findings provide a descriptive overview of applicants’ experiences and perceptions of the Australian visa process as it relates to postgraduate study and research collaboration.
The survey targeted Chinese nationals applying for postgraduate or research-related visas. Respondents from other national backgrounds were not included, meaning the findings should not be interpreted as exclusive to Chinese applicants.
2. Respondent profiles
The survey first established the academic backgrounds of participants in China, including their current institutional affiliations, and the positions they sought to hold in Australia. This information provides context for interpreting later findings on visa experiences, offering insight into the characteristics of the research and talent pipeline linking Chinese and Australian institutions. This section outlines respondents’ academic status in China, intended status in Australia, visa type, institution(s) attended in China, host institution and primary funding sources.
2.1 Current status in China
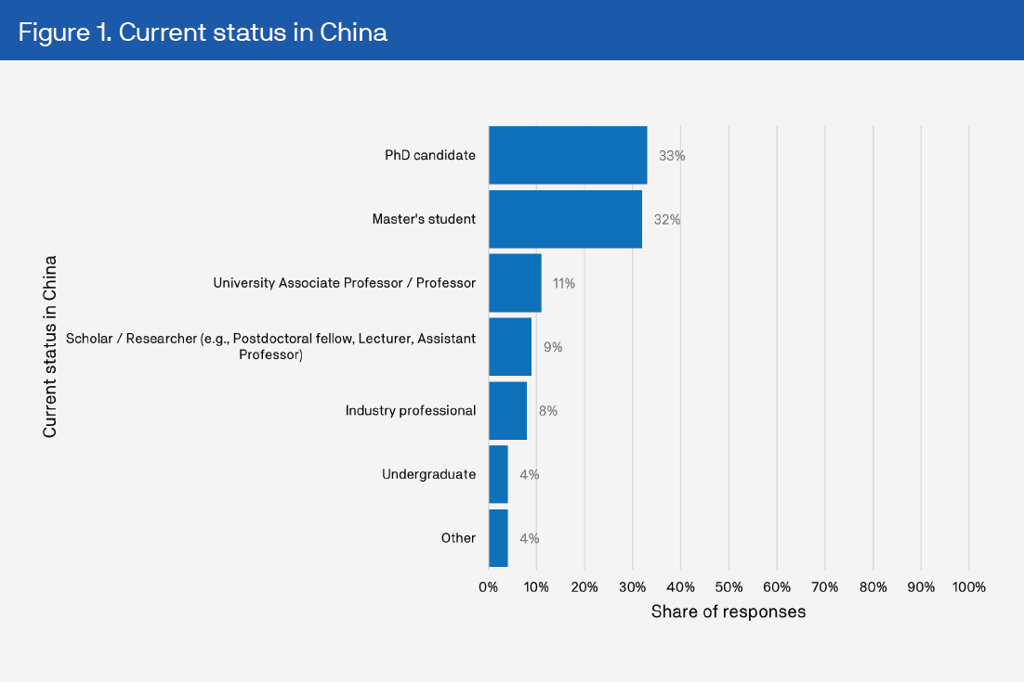
One-third (33 percent) were PhD candidates and almost as many (32 percent) were master’s students. Senior academics were also represented: associate professors or professors accounted for 11 percent, while scholars or researchers such as postdoctoral fellows, lecturers or assistant professors, comprised nine percent. Industry professionals (eight percent), undergraduates (four percent) formed smaller groups. Those who selected ‘other’ (four percent) made up the rest of the sample (Figure 1).
The write-in explanations of those who selected ‘other’ suggested that this group was largely made up of those in transitional academic stages.11
2.2 Intended status in Australia
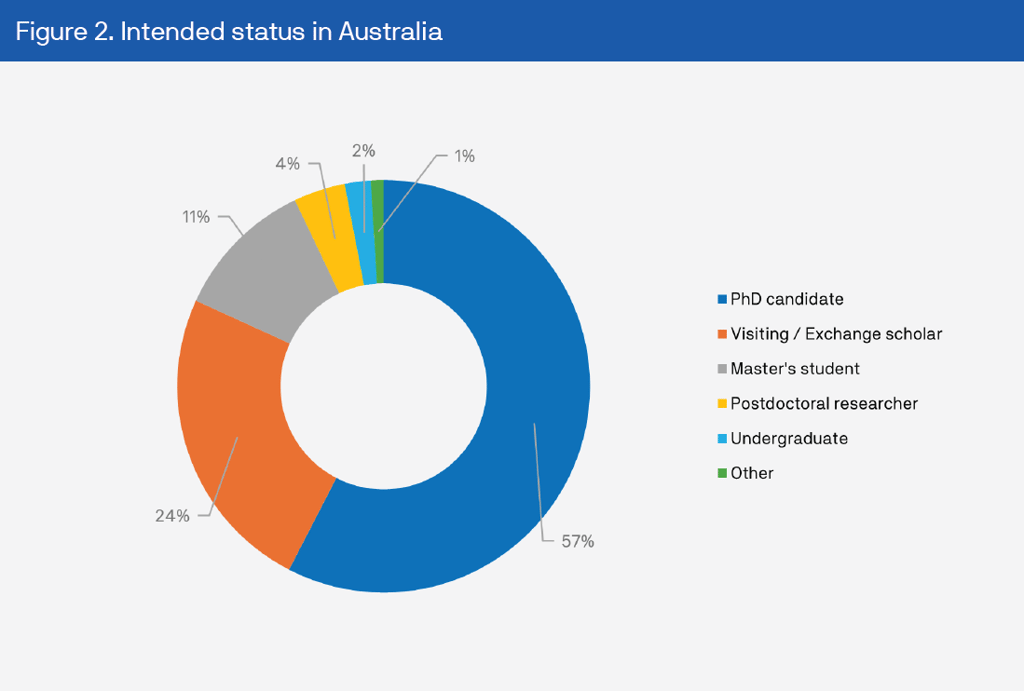
When asked about their intended status when applying for an Australian visa, the largest share applied as PhD candidates (57 percent), followed by visiting or exchange scholars (24 percent). Master’s students represented 11 percent, while postdoctoral researchers (four percent) and undergraduates (two percent) were smaller groups. A small proportion (one percent) selected ‘other’12 (Figure 2).
The strong continuity between current and intended statuses indicates that most applicants were seeking to continue an established academic trajectory.
2.3 Type of visa applied for
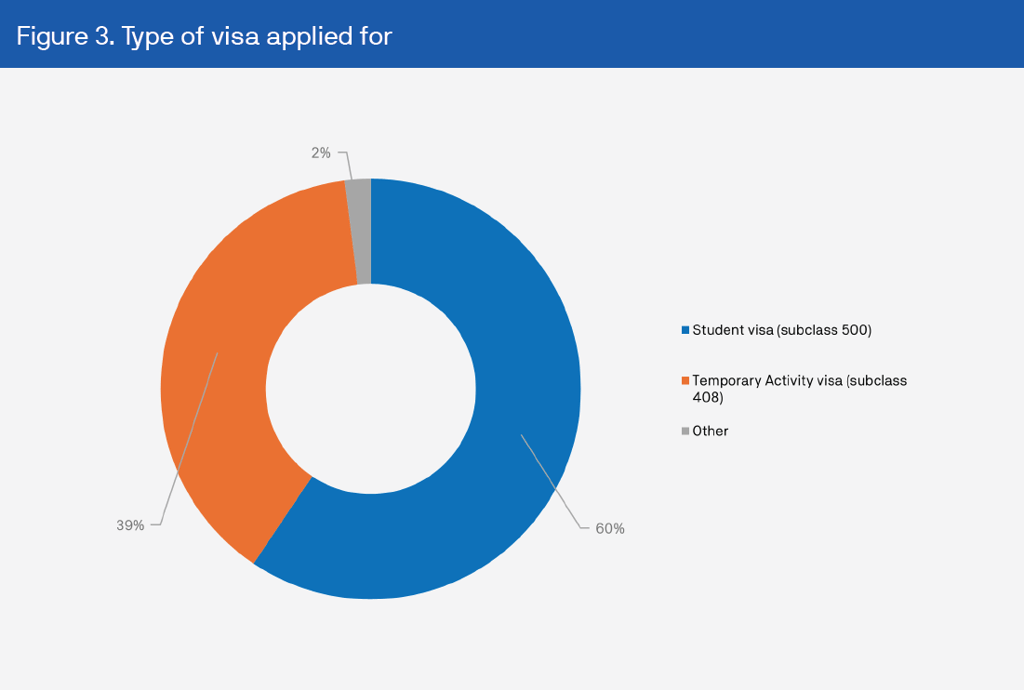
Respondents applied under a range of visa categories consistent with their academic roles. The Student visa (subclass 500) was the most common (60 percent), reflecting the large proportion of postgraduate applicants. The Temporary Activity visa (subclass 408), typically used for visiting researchers, exchange scholars or short-term projects, accounted for 39 percent. A small minority (two percent) applied for ‘other’ visa types (Figure 3).
Within this ‘other’ group, four respondents cited Visitor visas (subclass 600)m, one cited a Temporary Skill Shortage visa (subclass 482) and one cited a Skilled Nominated visa (subclass 190).
2.4 Universities or higher education institutions attended in China
Respondents’ prior study and research experience in China were primarily concentrated in science and engineering-focused universities.
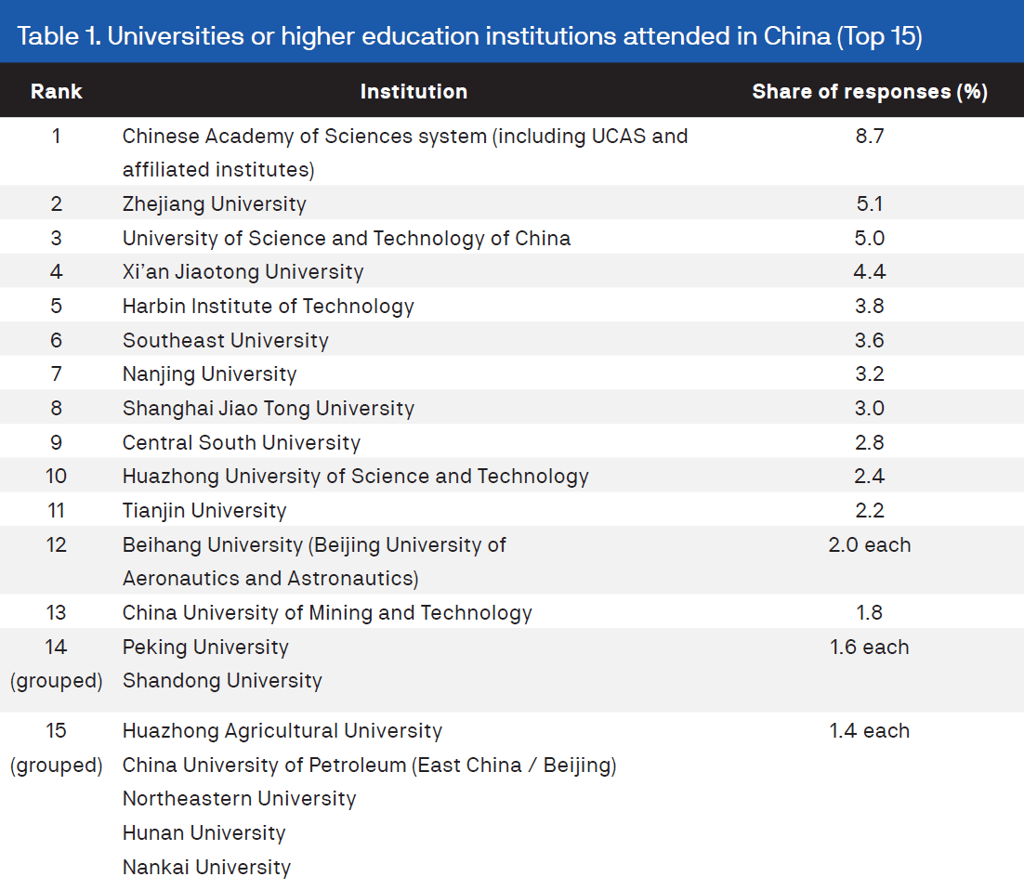
The Chinese Academy of Sciences system, including the University of Chinese Academy of Sciences (UCAS) and affiliated institutes, accounted for nine percent of all identifiable affiliations.
This was followed by Zhejiang University (five percent), the University of Science and Technology of China (five percent), Xi’an Jiaotong University (four percent) and Harbin Institute of Technology (four percent).
Other frequently mentioned institutions included Southeast University, Shanghai Jiao Tong University, Nanjing University, Central South University, Huazhong University of Science and Technology and Tianjin University. Peking University and Shandong University appeared next, followed by a secondary group consisting of Huazhong Agricultural University, China University of Petroleum, Northeastern University, Hunan University and Nankai University (Table 1).
Together, these 18 institutions accounted for approximately 47 percent of all identifiable Chinese higher-education affiliations reported by respondents.
Additional universities with smaller representation included Sun Yat-sen University, Wuhan University, China Agricultural University, Tongji University, Beijing Normal University and Xidian University, among others.
These distributions suggest that respondents were drawn from a diverse range of leading Chinese universities, though with a clear concentration in applied and technical disciplines.
2.5 Intended Australian host institution
Respondents’ intended destinations were concentrated in a small group of metropolitan, research-intensive universities.
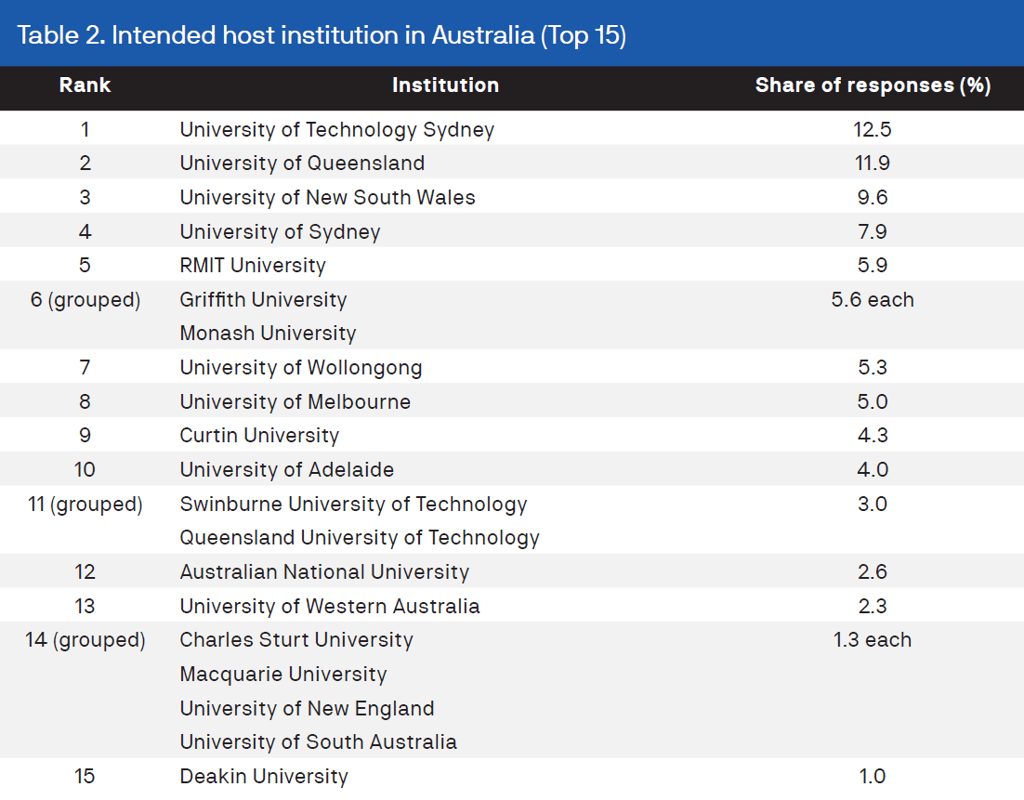
The University of Technology Sydney (UTS) (13 percent)1 and University of Queensland (12 percent) were the two most frequently nominated, together accounting for nearly one-quarter of all valid responses. They were followed by the University of New South Wales (10 percent), University of Sydney (eight percent) and RMIT University (six percent), rounding out the five most common intended hosts. Collectively, these institutions attracted almost half of all respondents (48 percent).
A second cluster included Monash University, Griffith University, University of Wollongong, University of Melbourne, Curtin University and University of Adelaide. Each drew a moderate share of applicants, typically between four and six percent, and together accounted for roughly one-third of intended destinations.
Other universities appearing in the next tier included Swinburne University of Technology, Queensland University of Technology and the Australian National University (two to three percent each). The University of Western Australia (two percent) and Deakin University (one percent) followed (Table 2).
At the margins, a group of institutions each received less than one percent of nominations. These included La Trobe University, Western Sydney University, James Cook University, the University of Tasmania, CSIRO, the University of Southern Queensland, Victoria University, the University of Newcastle and the Sydney Conservatorium of Music.
Taken together, these results underscore the gravitational pull of Australia’s large urban universities, particularly those in the Group of Eight (Go8), while also highlighting the strong appeal of technology-focused institutions. Combined, the Go8 and technology-specialist groupings account for nearly two-thirds of all stated destinations.
2.6 Funding
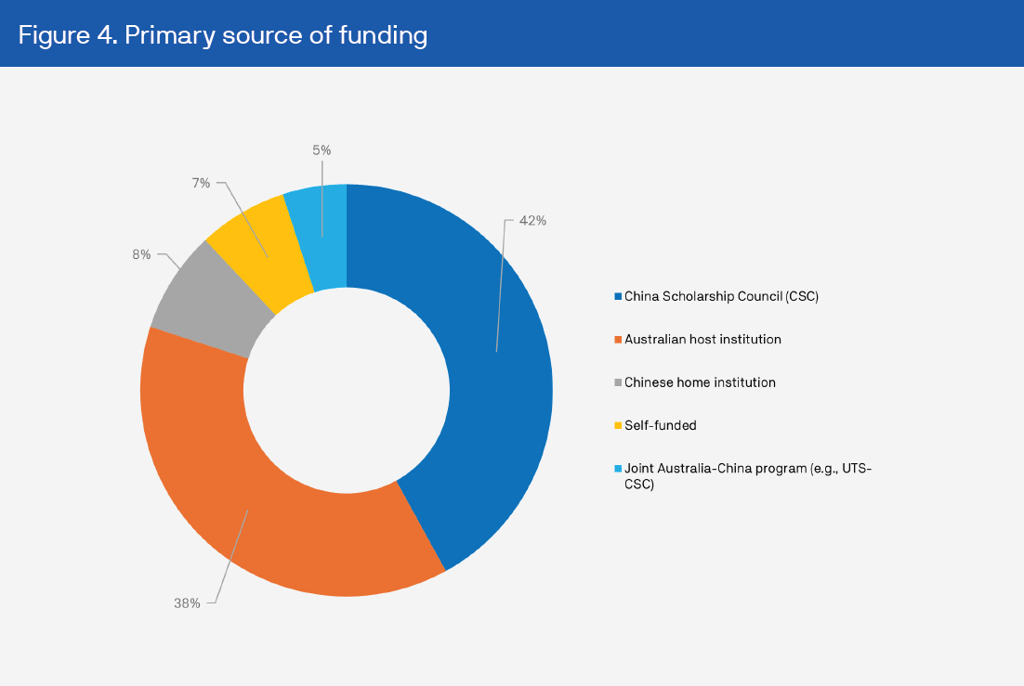
With respect to funding, the majority of respondents were supported by public or institutional scholarships or programs. The China Scholarship Council (CSC) was the single largest source (42 percent), followed by Australian host institutions (38 percent). Smaller proportions were funded by their Chinese home institutions (eight percent), were self-funded (seven percent) or were supported by joint Australia-China schemes, such as UTS-CSC collaborative programs (five percent) (Figure 4).
These figures indicate that bilateral research mobility is highly institutionalised, with more than four out of five applicants supported by either the Chinese state or by Australian universities.
3. Fields of study and research
The distribution of respondents’ academic disciplines reflected their institutional backgrounds, showing a strong concentration in STEM fields. This pattern is consistent with the broader profile of Chinese postgraduate mobility and with Australia’s strengths in applied and technological research.
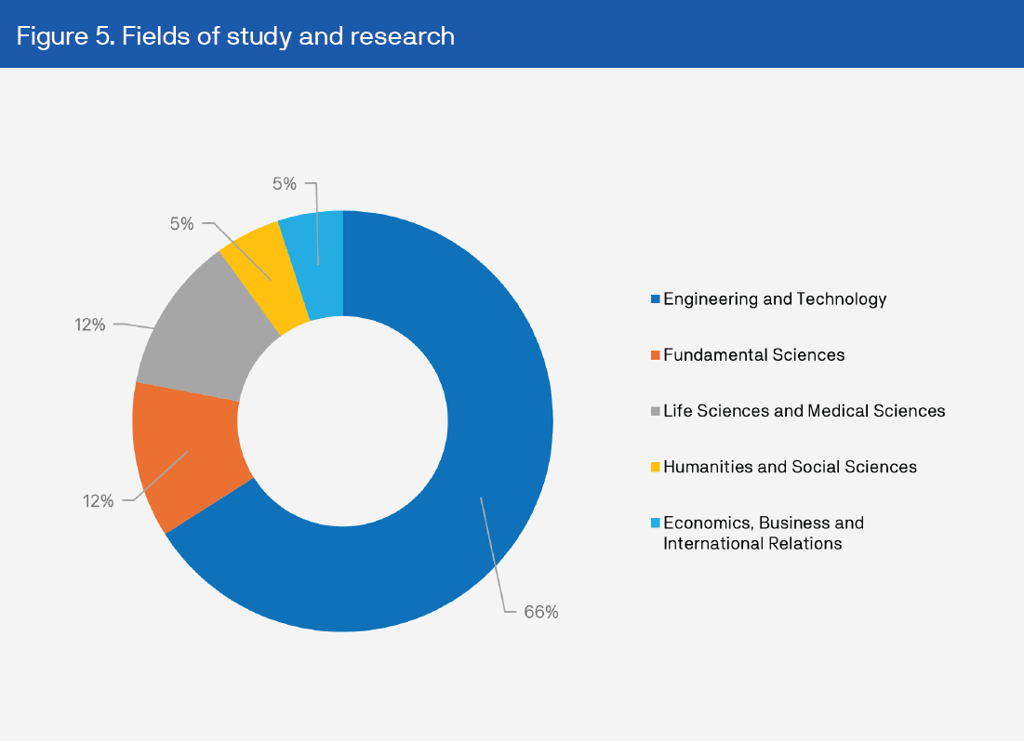
Engineering and Technology represented the largest group, accounting for two-thirds of respondents (66 percent), followed by Fundamental Sciences (mathematics, physics and chemistry) (12 percent) and Life Sciences and Medical Sciences (12 percent). Smaller proportions were reported in in the Humanities and Social Sciences (five percent) and Economics, Business and International Relations (five percent)14 (Figure 5).
3.1 Engineering and Technology sub-fields
Within Engineering and Technology, respondents represented a diverse array of technical disciplines.
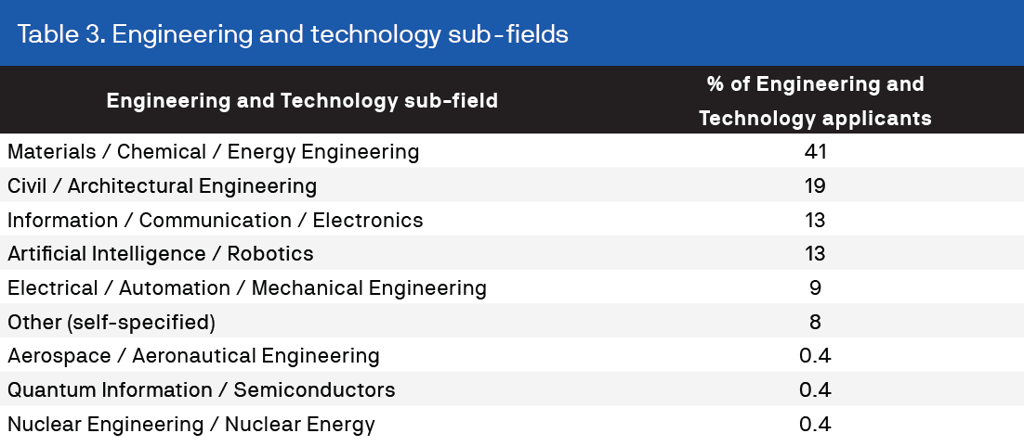
The most frequently cited sub-field was Materials / Chemical / Energy Engineering (41 percent). This was followed by Civil / Architectural Engineering (19 percent), Information / Communication / Electronics (13 percent), Artificial Intelligence / Robotics (13 percent) and Electrical / Automation / Mechanical Engineering (nine percent). Smaller proportions reported ‘other’ engineering fields (eight percent) and niche specialisations that were each represented by a single respondent, such as Quantum Information / Semiconductors (0.4 percent), Nuclear Engineering / Nuclear Energy (0.4 percent) and Aerospace / Aeronautical Engineering (0.4 percent) (Table 3).
Respondents selecting ‘other’ most frequently identified Environmental Engineering or Environmental Technology, with smaller numbers citing Biomedical Engineering, Computer Engineering, or areas such as Geology, Geophysics, Petroleum Engineering, Transportation Engineering, Ocean Engineering and Remote Sensing.
Together, these results indicate that Chinese postgraduate applicants to Australia are heavily concentrated in applied and technologically intensive fields, many of which overlap with areas of global research sensitivity.
4. Visa outcomes and waiting experiences
Visa processing outcomes represent a crucial stage in applicants’ mobility pathways, determining whether and when study or research in Australia can proceed.
This section examines the distribution of visa outcomes, waiting times and respondents’ experiences during the processing period. The results offer descriptive insight into applicants’ procedural experiences and perceptions of Australia’s research access environment. While the data do not permit inferences about administrative intent or policy differentiation, they provide a basis for understanding self-reported processing durations and procedural interactions.
4.1 Status and processing duration of visa applications
At the time of the survey, visa outcomes were heavily weighted toward pending cases (78 percent), indicating that a majority of applicants were still awaiting a decision. Twenty-one percent had received approval while one respondent (0.3 percent) reported rejection (Figure 6).
4.1.1 Approved cases
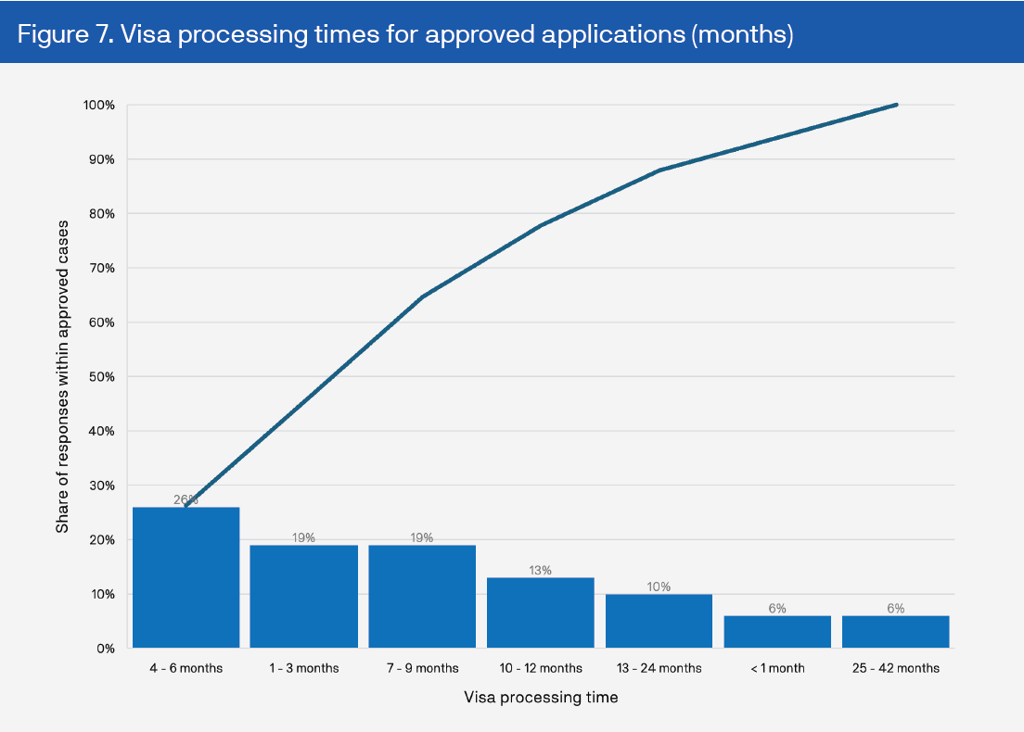
Among the respondents whose visas had been approved, reported processing times varied substantially.
Most approvals occurred within six months (45 percent), while 19 percent waited between seven and nine months, and 13 percent between 10 and 12 months.
Approximately 16 percent reported waiting longer than one year.
The median reported wait time was six months and the mean approximately seven months, reflecting the influence of a small number of extended cases (Figure 7).
Overall, while the majority of approved applications were finalised within half a year, a minority experienced significantly longer processing durations, suggesting variability in review times across individual cases.
4.1.2 Pending cases
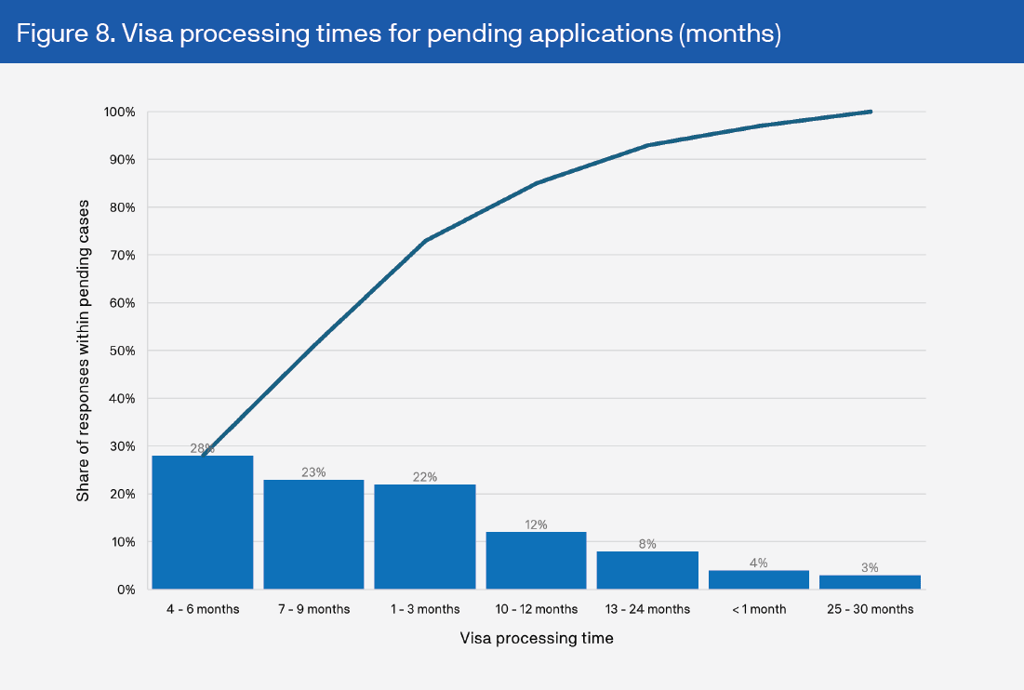
Among respondents whose applications were still pending at the time of the survey, waiting periods varied widely.
The median reported wait was six months and the mean was approximately 6.4 months. About one-quarter of respondents had been waiting for less than three months, while another quarter reported waits longer than nine months.
Roughly one in six indicated that their application had been pending for more than a year (Figure 8).
Pending applicants had already been waiting a median of six months, suggesting that overall processing times were lengthening for a subset of cases and that many cases were likely to extend further before resolution.
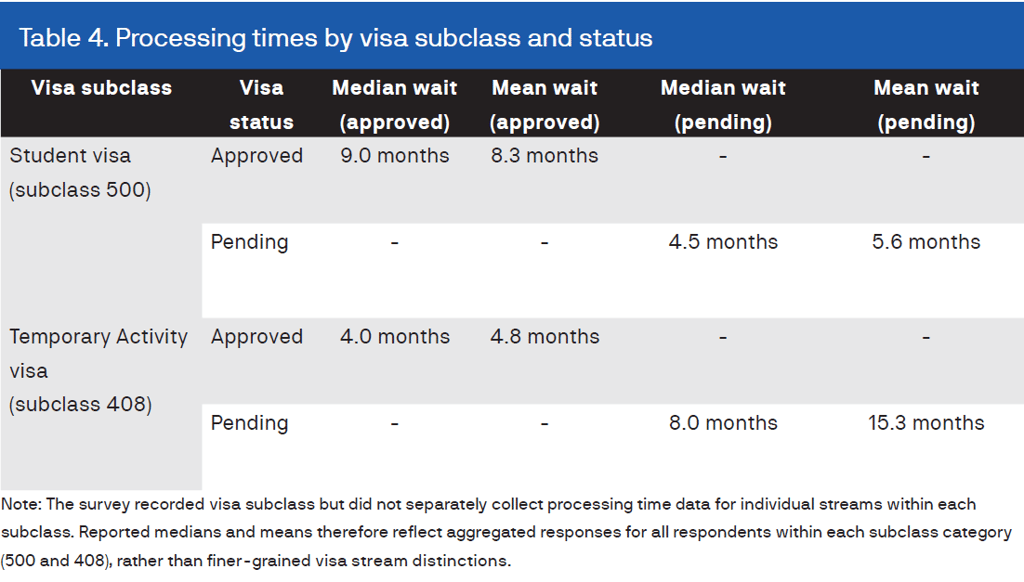
4.1.3 Comparison by visa subclass
Respondents applied primarily under two visa categories: the Student (subclass 500) and Temporary Activity (subclass 408) visas.
Student visa applicants represented the majority of responses and recorded longer median processing times among approved cases (nine months) compared with Temporary Activity visas (four months).
Among pending applications, the pattern was reversed. Temporary Activity visa applicants reported longer ongoing waits (median 8 months) than those awaiting Student visa outcomes (4.5 months) (Table 4).
Overall, the results indicate that waiting times varied by visa type, with Student visa approvals taking longer on average but Temporary Activity visa applications more likely to remain pending for extended periods.
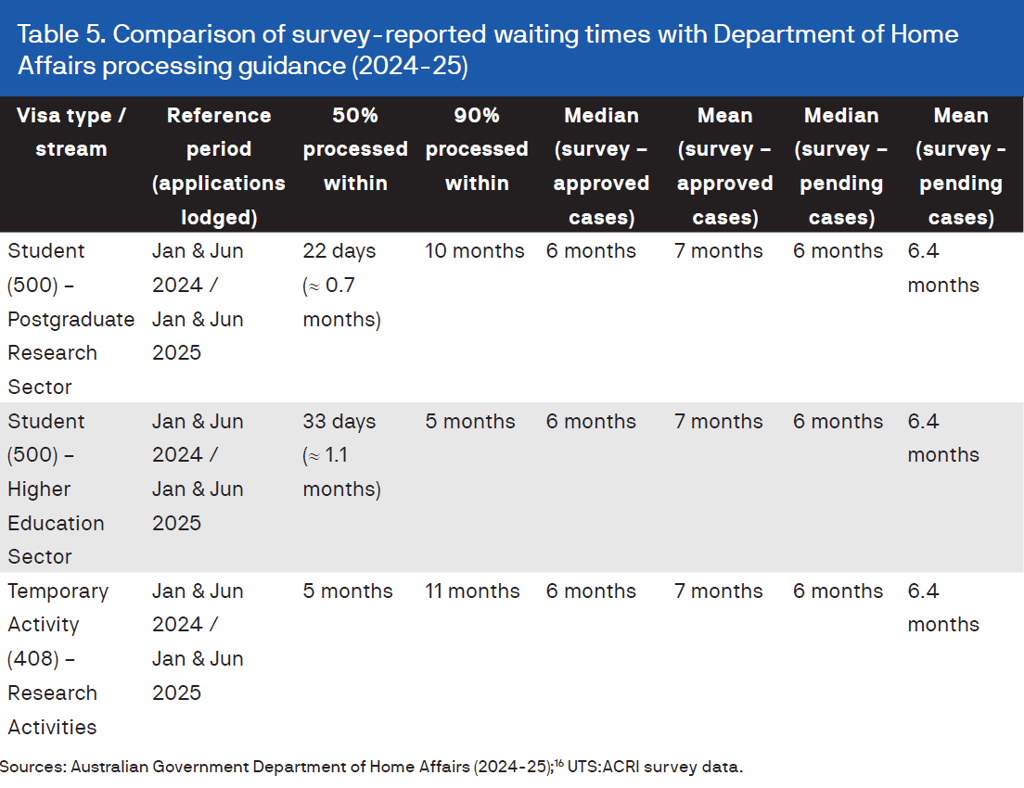
4.1.4 Comparison with Department of Home Affairs indicative processing times
To contextualise these findings, the survey results were compared with indicative processing times published by the Australian Department of Home Affairs, drawn from its online Visa Processing Times tool (Table 5).
Data were retrieved for four reference points (January 1 2024, June 1 2024, January 1 2025 and June 1 2025). These figures reflect recent processing outcomes and are updated periodically. They are indicative rather than prescriptive and not disaggregated by nationality, discipline, or case complexity.
According to departmental guidance, for student and research-related visa categories, half of all applications are typically finalised within one to five months, and 90 percent are completed within five to eleven months, depending on the specific stream.
When compared with these indicative durations, median processing times reported in the survey generally aligned with, or extended beyond, the Department’s 90th-percentile range. This suggests that while many applicants experienced durations consistent with published guidance, a notable share, particularly among pending cases, had already exceeded the upper end of typical processing times.
The survey data do not identify causes or administrative intent. Differences between applicant-reported experiences and indicative durations may reflect variations in case complexity, verification procedures or workload distribution across visa streams.
4.2 Disciplinary variation in visa processing
To assess whether processing experiences differed across academic fields, visa outcomes and waiting times were cross-referenced with respondents’ self-reported research disciplines.
Processing outcomes differed markedly by discipline. Applicants in Engineering and Technology represented the largest cohort overall and also recorded the highest proportion of pending cases.
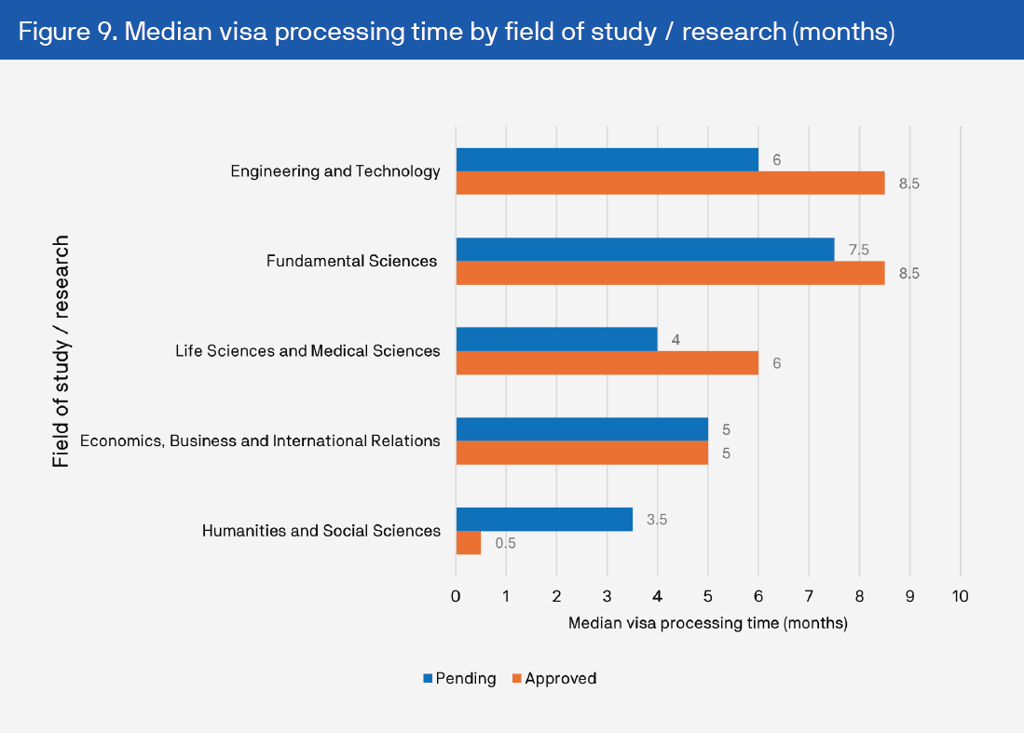
Among approved applications in Engineering and Technology, the median waiting time was 8.5 months, while the median for pending cases was six months.
The Fundamental Sciences showed a similar pattern, with median pending waits of seven-and-a-half months and approved waits of 8.5 months.
By contrast, applicants in the Humanities and Social Sciences reported the shortest median processing durations, with 0.5 months for approved cases and 3.5 months for pending ones.
Respondents in Life and Medical Sciences, as well as in Economics, Business and International Relations, reported intermediate processing durations, with median waits of approximately five months for approved applications and six months for pending applications (Figure 9).
The cross-tabulation suggests a disciplinary gradient in visa-processing times, with longer processing times concentrated in STEM-intensive fields.
This pattern is broadly consistent with external observations that visa assessments for technical or dual-use research areas may involve heightened verification. However, the dataset itself does not specify the administrative rationale for these differences, and no inference can be made about causality or policy intent.
Only one single rejection was recorded in the entire sample, occurring in the Engineering and Technology category – too few for inference but directionally consistent with greater scrutiny in technical disciplines.
It is also important to interpret these findings with caution.
Chinese outbound postgraduate mobility is disproportionately concentrated in STEM disciplines, meaning that engineering and science applicants form a much larger share of the total applicant pool.
Consequently, observed differences in waiting times could reflect volume and queue effects, that is, larger caseloads within certain visa assessment streams, rather than systematic differences in review intensity.
Overall, the results indicate that while processing times vary by academic discipline, the underlying mechanisms are ambiguous. Applicants in Engineering and Technology and the Fundamental Sciences appear to experience longer waits on average, whether due to application volumes, differentiated risk-assessment processes or a combination of both.
These findings highlight the importance of continued transparency in visa processing benchmarks and clear communication of procedural expectations across all research fields.
5. Procedural developments during the visa processing period
To assess how applicants interacted with Australian immigration authorities after submitting their visa applications, respondents were asked whether they had encountered any form of communication, request or instruction during the waiting period.
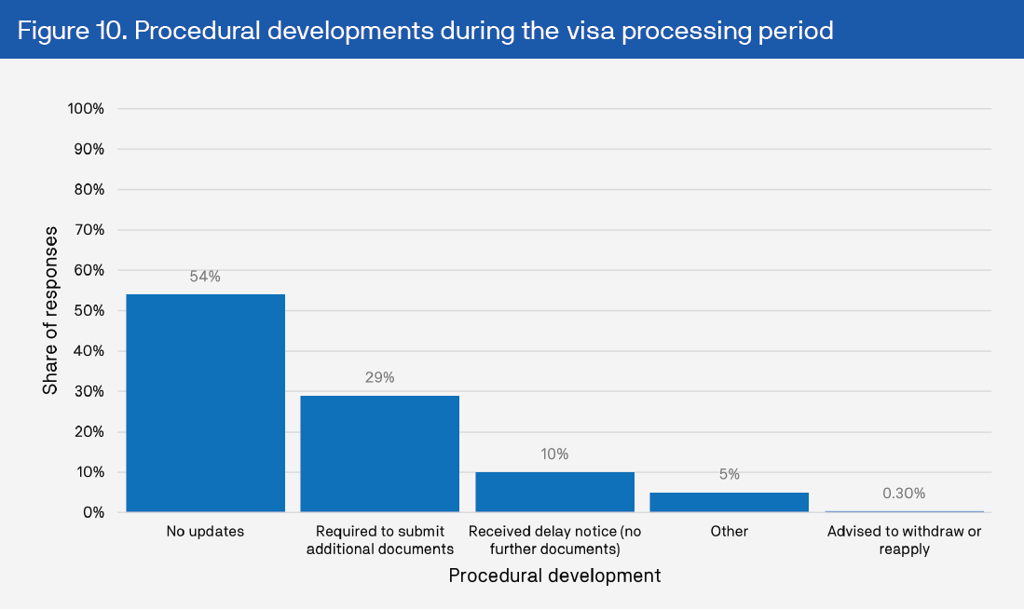
The majority of respondents (54 percent) reported no updates following submission, indicating that beyond the initial automated acknowledgement of receipt, no further correspondence was received.
Nearly one-third (29 percent) indicated that they were required to submit additional documents. The survey question did not request elaboration and respondents who selected this option generally did not specify the nature of the materials submitted. Based on the standard administrative requirements of the relevant visa subclasses, such requests are likely to have involved items such as updated health examinations, proof of funding or confirmation of enrolment and institutional affiliation. However, this interpretation should be regarded as procedural inference rather than direct respondent evidence.
A smaller group (10 percent) reported receiving a formal delay notice confirming that their case was under further assessment but without specifying a completion timeframe. One respondent (0.3 percent) reported being advised to withdraw or reapply, while five percent selected ‘other’ (Figure 10).
Open-text explanations provided by those who selected ‘other’ suggest that most of these applicants were asked to re-submit Form 1221 – Personal Particulars for Assessment Including Character Assessment, an official Department of Home Affairs instrument used to collect additional biographical and background information as part of the visa character assessment process. Within this dataset, respondents who reported a Form 1221 resubmission request were concentrated in Engineering and Technology and Fundamental Sciences fields.
A small number of ‘other’ responses instead referred to communications from host universities, such as extensions of commencement dates or re-issuance of offer letters.
Overall, the results indicate that direct administrative engagement during processing was limited. The majority of applicants received no updates; a smaller subset were asked for additional information or received formal delay notices.
6. Effects of visa processing times
Respondents were asked to assess the extent to which visa processing times affected their study or research plans and whether those experiences had led them to consider alternative destinations for study or research.
6.1 Impact on applicants’ study, work or other plans
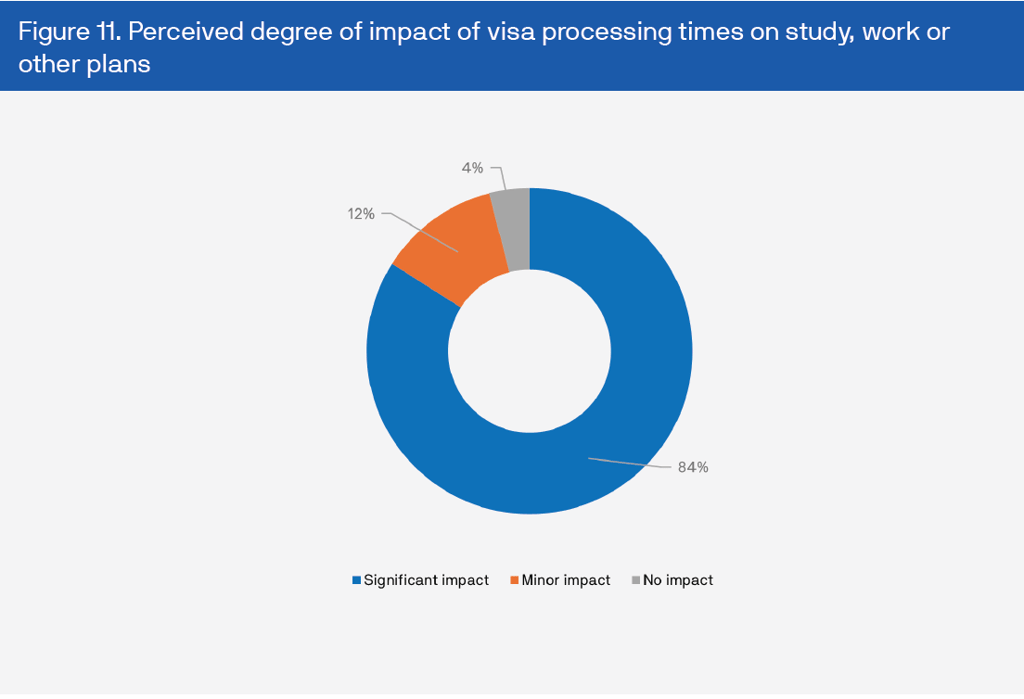
Most respondents indicated that visa processing durations had materially affected their plans.
Eighty-four percent described the impact as ‘significant’, 12 percent as ‘minor’ and four percent as ‘no impact’.
A small proportion (two percent) indicated ‘not applicable’ (Figure 11).
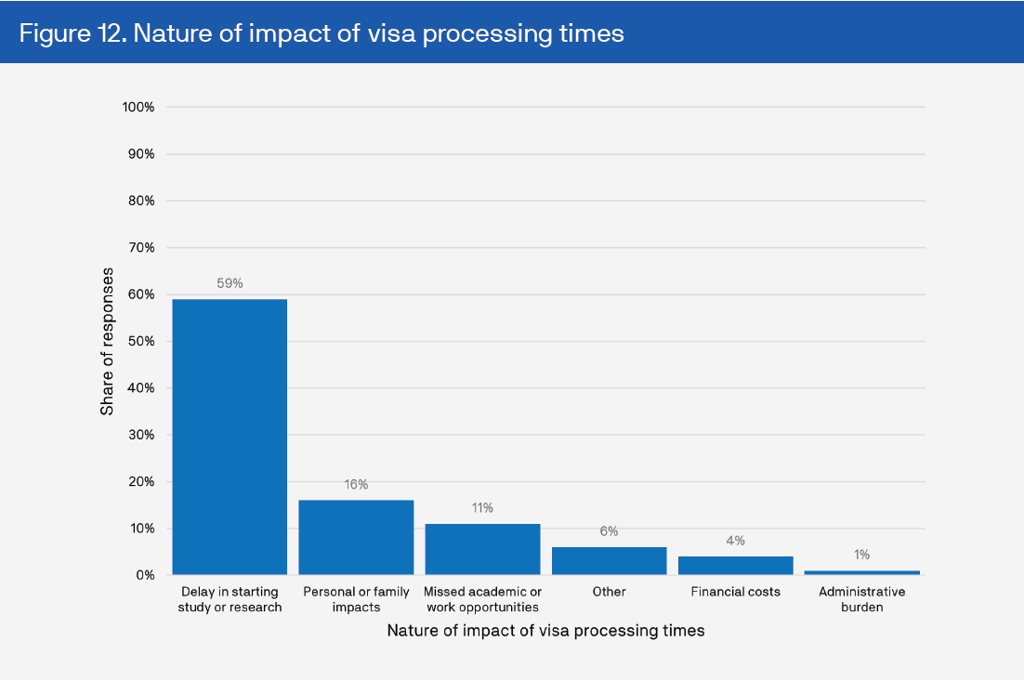
Among respondents who reported that their plans were affected, the most frequently reported consequence was a ‘delay in starting study or research’ (59 percent).
The next most common were ‘personal or family impacts’ (16 percent) and ‘missed academic or work opportunities’ (11 percent).
Smaller proportions cited ‘financial costs’ (four percent), ‘administrative burden’ (one percent) or selected ‘other’ (six percent) (Figure 12).
Those who selected ‘other’ indicated in written response that most or all aforementioned plans were affected.
These distributions indicate that the principal reported effect of extended visa processing times was temporal disruption, that is, the postponement of study or research commencement, followed by personal and opportunity-related impacts.
Financial and administrative consequences were less frequently identified.
6.2 Consideration of alternative destinations for study or research
Visa-related uncertainty also influenced applicants’ consideration of study or research options in other countries.
When asked whether they had contemplated other destinations because of visa delays, responses were divided across four categories.
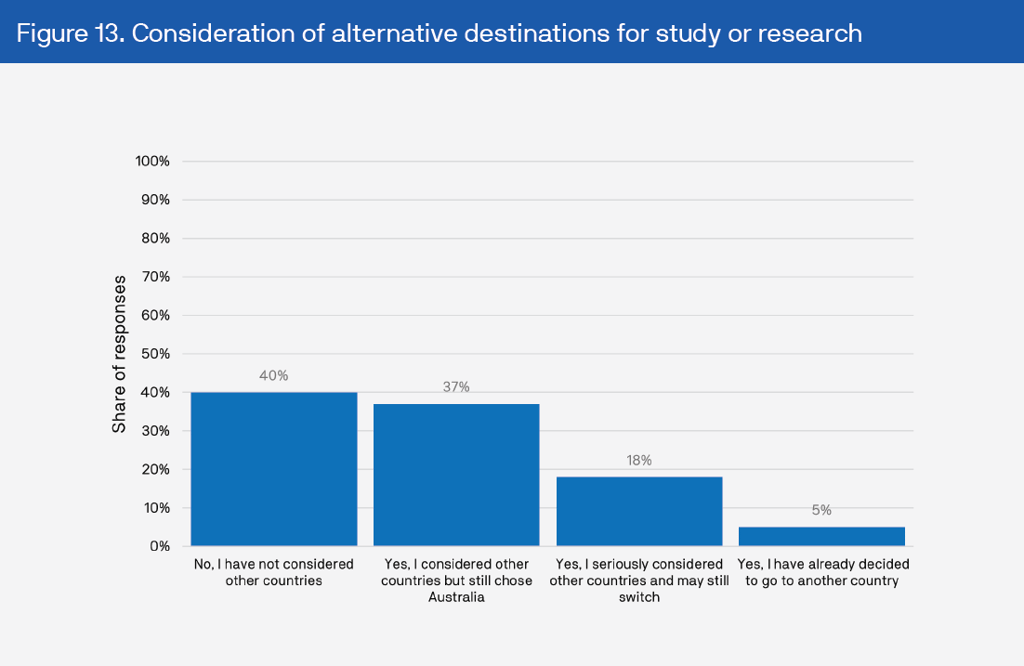
Forty percent of respondents indicated that they had not considered studying or conducting research in another country. Thirty-seven percent had considered alternative destinations but ultimately still planned to choose Australia. Eighteen percent had seriously explored other options and remained undecided, while five percent had already decided to pursue study or research elsewhere (Figure 13).
Overall, approximately six in ten respondents (60 percent) had at least contemplated moving their study or research to another country.
This pattern suggests that that while Australia remains an attractive destination, processing uncertainty introduces measurable risk in applicants’ decision-making and planning timelines.
6.3 Perceived reasons for duration of visa processing times
Respondents were asked to indicate what they believed to be the main reasons for the duration of visa processing times.
Because the question allowed multiple selections, the responses reflect overlapping perceptions rather than exclusive categories.
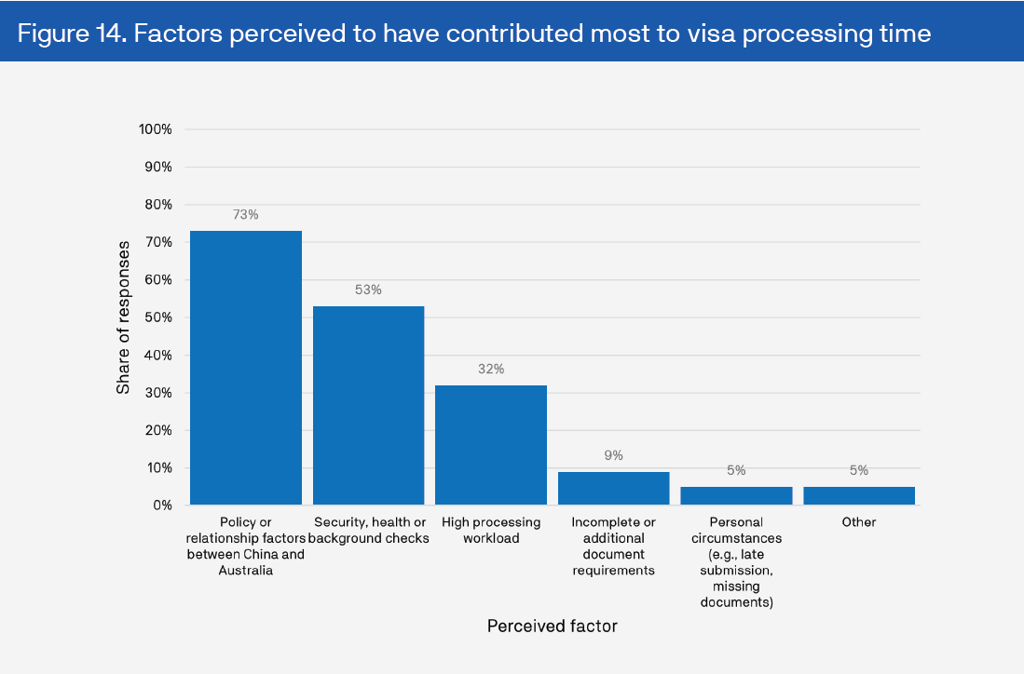
The most frequently cited perceived reason was ‘policy or bilateral relationship factors between China and Australia’ (73 percent).
This was followed by ‘security, health or background checks’ (53 percent) and ‘high processing workload’ (32 percent).
Smaller shares identified ‘incomplete or additional document requirements’ (9 percent), ‘personal circumstances, such as late submission’ (five percent) and ‘other’ (five percent) (Figure 14).
Open-text explanations from those selecting ‘other’ largely reiterated these categories, providing brief explanations that reiterated or nuanced the predefined options rather than introducing entirely new categories.
Overall, these responses indicate that most participants interpreted the duration of visa processing times through a geopolitical and procedural lens.
While some acknowledged administrative or individual factors, the prevailing perception was that bilateral politics and security-related vetting played a significant role in processing times.
7. Open-ended feedback
A large number of respondents provided written comments regarding their experiences with the Australian visa application process. The qualitative responses were reviewed and grouped thematically.
The most frequently cited theme was delay and uncertainty, mentioned in roughly two-thirds (68 percent) of all responses. Respondents described visa waiting periods as ‘long’, ‘unpredictable’, ‘without progress updates’ or ‘impossible to plan around’. Several noted that they were unable to make travel, housing or funding arrangements while awaiting outcomes. One respondent said:
I have been waiting more than 10 months with no reply. My offer will expire before the visa comes.
Approximately one-quarter (26 percent) of comments referred to communication and transparency. These respondents commonly requested clearer information on the status of applications and more reliable channels for inquiry. One comment suggested that ‘an online progress tracker or automatic email update would reduce anxiety’, while another said that ‘no one could tell me whether my documents were received.’
A smaller subset (12 percent) expressed concern about fairness or consistency in processing. These comments mentioned perceptions of differential treatment between nationalities or fields of study. One respondent wrote:
It seems science and engineering applicants wait longer, but we never know why.
Roughly eight percent proposed administrative or procedural improvements, such as simplified document requirements and improved coordination between universities and immigration authorities. Examples included: ‘Allow universities to certify funding directly’ and ‘Combine repeated health checks into one step.’
Finally, a small minority (fewer than five percent) characterised their experience positively, using phrases such as ‘smooth’, ‘reasonable’, ‘efficient’ or ‘faster than expected’.
Overall, these qualitative responses indicated that respondents’ concerns centred on timeliness and clarity rather than on the principle of security screening itself.
Comments commonly emphasised procedural predictability in terms of the desire for clearer guidance on expected processing durations and communication protocols.
While the number of explicitly positive accounts was small, they suggest that efficient and transparent cases are recognised by applicants and may help reinforce confidence in the system when consistently achieved.
8. Conclusion
The survey provides an indicative overview of how Chinese postgraduate students and researchers experienced Australia’s visa application process in 2025.
While not representative of the broader applicant population, the results highlight recurring procedural features reported by respondents, particularly extended waiting periods and limited communication during processing. A majority indicated that these factors had significantly affected their study or research plans, mainly through delays to commencement and uncertainty about scheduling.
Differences across academic disciplines were evident, with longer median processing times reported in Engineering and Technology and the Fundamental Sciences, and comparatively shorter durations in the Humanities, Social Sciences, and Business-related fields. These variations cannot be attributed to specific causes within the available data but may reflect differences in application volume, verification requirements, or other administrative factors.
When compared with indicative processing times published by the Department of Home Affairs, the median durations reported in the survey generally aligned with or exceeded the Department’s 90th-percentile range, particularly among pending applications. This suggests that while many applicants experienced processing durations consistent with published guidance, a non-trivial subset encountered longer and more variable timelines.
Open-ended responses consistently emphasised the importance of timeliness, clarity and predictability in the visa process. Respondents did not question the need for integrity or security procedures but noted limited transparency regarding progress updates and communication during the review period.
Taken together, the findings provide a descriptive snapshot of Chinese postgraduate applicants’ visa experiences during 2025. They suggest that Australia remains an attractive destination for advanced study and research collaboration, though variability and limited transparency in visa processing were perceived as key challenges within that experience.
Methodology
Responses were collected between August 28 and September 19 2025, yielding 371 valid entries.
The survey employed a non-probability, convenience sampling approach, distributed through WeChat groups and academic networks. Participation was voluntary. Because distribution relied on social and professional networks, the sample is not statistically representative of the broader applicant population and findings should be interpreted as indicative rather than generalisable.
While convenience sampling limits inferential scope, the survey design aligns with established practices for exploratory research on defined subpopulations. Methodological literature notes that ‘homogeneous convenience samples’ – those drawn from a specific, internally similar group – can provide meaningful insights when probability sampling is impractical.15
Open-text responses were standardised for spelling and institutional naming consistency. Quantitative results were calculated as percentages of valid responses, rounded to one decimal place; totals may not sum to 100 due to rounding. Missing or incomplete responses were excluded from analysis.
Limitations
Convenience sampling may have introduced self-selection bias, as individuals experiencing visa difficulties may have been more inclined to participate. In addition, the absence of publicly available official visa data disaggregated by country of origin, field of study / research and institution limits comparability with the wider applicant population. Finally, all findings are based on self-reported experiences, which may not fully align with administrative records.
Despite these limitations, the dataset offers a unique and timely perspective on Chinese postgraduate applicants’ experiences navigating Australia’s visa system and the potential implications for research collaboration and mobility.
Endnotes
- Clarivate, ‘InCites Benchmarking and Analytics’, accessed September 19 2025 <https://clarivate.com/academia-government/scientific-and-academic-research/research-funding-analytics/incites-benchmarking-analytics/>.
- Macro Polo, ‘The Global AI Talent Tracker 2.0’, accessed October 7 2025 <https://archivemacropolo.org/interactive/digital-projects/the-global-ai-talent-tracker/>.
- Australian Security Intelligence Organisation, ‘ASIO submission to the Parliamentary Joint Committee on Intelligence and Security Inquiry into National Security Risks affecting the Australian higher Education and Research Sector’, December 18 2020 <https://www.aph.gov.au/Parliamentary_Business/Committees/Joint/Intelligence_and_Security/NationalSecurityRisks/Submissions>.
- Rosemary Huxtable, Review of the Foreign Arrangements Scheme Final Report, Commonwealth of Australia, February 16 2025 <https://www.foreignarrangements.gov.au/sites/default/files/2025-09/report_of_the_review_of_the_foreign_arrangements_scheme_-_accessible_version.pdf>.
- Australian Government Department of Foreign Affairs and Trade, ‘Australia’s Foreign Relations (State and Territory Arrangements) Act 2020 – Guidance on institutional autonomy’, March 2021 <https://www.foreignarrangements.gov.au/sites/default/files/2021-03/Guidance%20on%20Institutional%20Autonomy.pdf>.
- Australian Academy of Science, ‘Australian Academy of Science symposium 2023 – International scientific collaboration in a contested world’, YouTube, November 14 2023 <https://www.youtube.com/watch?v=qWOFmzggOU8>.
- John Ross, ‘Australia ‘oversimplifies’ China research collaboration risks’, Times Higher Education, April 22 2025 <https://www.timeshighereducation.com/news/australia-oversimplifies-china-research-collaboration-risks>.
- Kirsty Needham, ‘Claims Chinese researchers blocked from Australian universities’, Sydney Morning Herald, March 14 2018 <https://www.smh.com.au/world/asia/claims-chinese-researchers-blocked-from-australian-universities-20180313-p4z482.html>; Nick Bonyhady, ‘'Great concern': Chinese embassy hits out at visa delays’, Sydney Morning Herald, January 19 2020 <https://www.smh.com.au/politics/federal/great-concern-chinese-embassy-hits-out-at-visa-delays-20200118-p53sm9.html>; Caitlin Cassidy, ‘Visa delays caused by security checks turning Chinese students away from Australian universities’, The Guardian, February 19 2023 <https://www.theguardian.com/australia-news/2023/feb/19/visa-delays-caused-by-security-checks-turning-chinese-students-away-from-australian-universities>.
- Australian Government Data.gov.au, ‘BP0015 Student visas grant rates at 2025-08-31’, September 29 2025 <https://data.gov.au/data/dataset/student-visas/resource/60a04f87-b974-4902-87e0-55dc5d37ccda>.
- Ibid.
- Several respondents explained that they had already graduated from a master’s program and were awaiting PhD visas, often unemployed in the meantime, while others described themselves as research assistants or noted that they had quit jobs in anticipation of studying in Australia. A few explicitly described taking a ‘gap’ period while waiting for visa outcomes, and one noted that they had already lodged their application in mid-2024 and were by then already in Australia. These responses show that the ‘other’ category did not represent an entirely separate constituency but rather a set of applicants caught between formal categories at the time of the survey.
- These ‘other’ applicants again provided clarifications suggesting hybrid roles not neatly captured by the survey categories. For example, some described themselves as ‘visiting PhD candidates’ or ‘Associate Research Fellows’.
- The relatively high proportion of respondents nominating the University of Technology Sydney (UTS) as their intended host may reflect the fact that the survey was distributed primarily through academic networks in which UTS staff were more actively involved.
- A small number of respondents (n=3) provided a field of study in the ‘other (please specify)’ box despite not selecting ‘other.’ These cases were left in their original predefined categories. The 10 cases that did select ‘other’ were reassigned to the most appropriate main category based on their free-text descriptions.
- Ibid.
- Justin Jager, Diane L. Putnick and Marc H. Bornstein (2017), ‘More than just convenient: The scientific merits of homogeneous convenience samples’, Monographs of the Society for Research in Child Development 82(2) pp. 13-30 at p.13 <https://srcd.onlinelibrary.wiley.com/doi/full/10.1111/mono.12296>.
AUTHOR

Director, Australia-China Relations Institute And Professor, DVC (International & Development)
AUTHOR

Manager, Research Analysis, Australia-China Relations Institute, University of Technology Sydney
Author

Deputy Director, Australian-China Relations Institute, DVC (International & Development)
AUTHOR

Associate Professor - Research, Australia-China Relations Institute, University of Technology Sydney
AUTHOR

Research Principal, DVC (International & Development)
News
Australia-China Weekly Brief: July 2026 issues
The Australia-China Weekly Brief by the Australia-China Relations Institute at the University of Technology Sydney (UTS:ACRI) tracks key developments in...
News
Can APEC reinvent itself?
share_windows This policy brief appeared in the Toda Peace Institute's Policy Briefs and Reports series on July 24 2026.

News
“Weaving a cocoon to imprison itself”: Australia’s China research dilemma
Australia risks missing out on access to world-class science and technology by taking on overly restrictive approach to research collaborations with China,...

News
Chinese companies are taking over the EV market. What’s behind their meteoric rise?
In response, Australia must strengthen standards around data security, vehicle safety and battery recycling.
News
Australia-China Weekly Brief: July 2026 issues
The Australia-China Weekly Brief by the Australia-China Relations Institute at the University of Technology Sydney (UTS:ACRI) tracks key developments in...
News
Can APEC reinvent itself?
share_windows This policy brief appeared in the Toda Peace Institute's Policy Briefs and Reports series on July 24 2026.
News
“Weaving a cocoon to imprison itself”: Australia’s China research dilemma
Australia risks missing out on access to world-class science and technology by taking on overly restrictive approach to research collaborations with China,...
News
Chinese companies are taking over the EV market. What’s behind their meteoric rise?
In response, Australia must strengthen standards around data security, vehicle safety and battery recycling.