
Site navigation

  • University of Technology Sydney home
  • Home

    Home
  • For students

  • For industry

  • Research

Explore

  • Courses
  • Events
  • News
  • Stories
  • People

For you

  • Libraryarrow_right_alt
  • Staffarrow_right_alt
  • Alumniarrow_right_alt
  • Current studentsarrow_right_alt
  • Study at UTS

    • arrow_right_alt Find a course
    • arrow_right_alt Course areas
    • arrow_right_alt Undergraduate students
    • arrow_right_alt Postgraduate students
    • arrow_right_alt Research Masters and PhD
    • arrow_right_alt Online study and short courses
  • Student information

    • arrow_right_alt Current students
    • arrow_right_alt New UTS students
    • arrow_right_alt Graduates (Alumni)
    • arrow_right_alt High school students
    • arrow_right_alt Indigenous students
    • arrow_right_alt International students
  • Admissions

    • arrow_right_alt How to apply
    • arrow_right_alt Entry pathways
    • arrow_right_alt Eligibility
arrow_right_altVisit our hub for students

For you

  • Libraryarrow_right_alt
  • Staffarrow_right_alt
  • Alumniarrow_right_alt
  • Current studentsarrow_right_alt

POPULAR LINKS

  • Apply for a coursearrow_right_alt
  • Current studentsarrow_right_alt
  • Scholarshipsarrow_right_alt
  • Featured industries

    • arrow_right_alt Agriculture and food
    • arrow_right_alt Defence and space
    • arrow_right_alt Energy and transport
    • arrow_right_alt Government and policy
    • arrow_right_alt Health and medical
    • arrow_right_alt Corporate training
  • Explore

    • arrow_right_alt Tech Central
    • arrow_right_alt Case studies
    • arrow_right_alt Research
arrow_right_altVisit our hub for industry

For you

  • Libraryarrow_right_alt
  • Staffarrow_right_alt
  • Alumniarrow_right_alt
  • Current studentsarrow_right_alt

POPULAR LINKS

  • Find a UTS expertarrow_right_alt
  • Partner with usarrow_right_alt
  • Explore

    • arrow_right_alt Explore our research
    • arrow_right_alt Research centres and institutes
    • arrow_right_alt Graduate research
    • arrow_right_alt Research partnerships
arrow_right_altVisit our hub for research

For you

  • Libraryarrow_right_alt
  • Staffarrow_right_alt
  • Alumniarrow_right_alt
  • Current studentsarrow_right_alt

POPULAR LINKS

  • Find a UTS expertarrow_right_alt
  • Research centres and institutesarrow_right_alt
  • University of Technology Sydney home
Explore the University of Technology Sydney
Category Filters:
University of Technology Sydney home University of Technology Sydney home
  1. home
  2. arrow_forward_ios ... For students
  3. arrow_forward_ios ... Current students
  4. arrow_forward_ios ... Student support
  5. arrow_forward_ios ... HELPS
  6. arrow_forward_ios ... Self-help resources
  7. arrow_forward_ios Academic language
  8. arrow_forward_ios How to report data

How to report data

explore
  • Self-help resources
    • Grammar
      • arrow_forward Articles
      • arrow_forward Formal and informal language
      • arrow_forward Parts of speech
      • arrow_forward Prepositions
      • arrow_forward Present vs. past tense
      • arrow_forward Punctuation
      • arrow_forward Sentence structures
      • arrow_forward Subject-verb agreement
      • arrow_forward Transition signals
      • arrow_forward Reporting verbs
    • Academic language
      • arrow_forward How to report data
      • arrow_forward How to write in an academic style
      • arrow_forward How to write better sentences
      • arrow_forward Link your ideas effectively
      • arrow_forward Write better emails
    • Academic skills
      • arrow_forward How to analyse your assignment task
      • arrow_forward How to avoid plagiarism
      • arrow_forward How to develop an argument
      • arrow_forward How to paraphrase effectively
      • arrow_forward How to read critically
      • arrow_forward How to synthesise various sources
      • arrow_forward How to write a conclusion
      • arrow_forward How to write critically
      • arrow_forward How to write a good paragraph
      • arrow_forward How to write an introduction
    • GenAI learning resources
      • arrow_forward Assisting with reading
      • arrow_forward Assisting with writing
      • arrow_forward Brainstorming and generating ideas
      • arrow_forward Creating and delivering presentations
      • arrow_forward Creating study plans
      • arrow_forward Revising for exams
      • arrow_forward Understanding difficult concepts
    • Postgraduate resources
      • arrow_forward Create a Conference Presentation
      • arrow_forward How to Write a Research Proposal
      • arrow_forward Common pitfalls - Doctoral assessment
    • arrow_forward Sample written assignments
    • Types of assignments
      • arrow_forward Annotated bibliographies
      • arrow_forward Case Studies
      • arrow_forward Essays
      • arrow_forward Group presentation skills
      • arrow_forward Group Work
      • arrow_forward Literature reviews
      • arrow_forward Presentation Skills
      • arrow_forward Reflective tasks
      • arrow_forward Reports
    • arrow_forward Using Turnitin

What should we include when presenting data?

data

When reporting on facts, figures and statistics in an academic context you should:


  • explain where your information came from;
  • focus on the most significant or notable results of your research;
  • discuss, interpret and evaluate your findings and why the data is useful.

What does the presentation of data look like in academic writing?

Below is an example of how data can be presented and analysed. Click on each arrow to see more information.

Findings

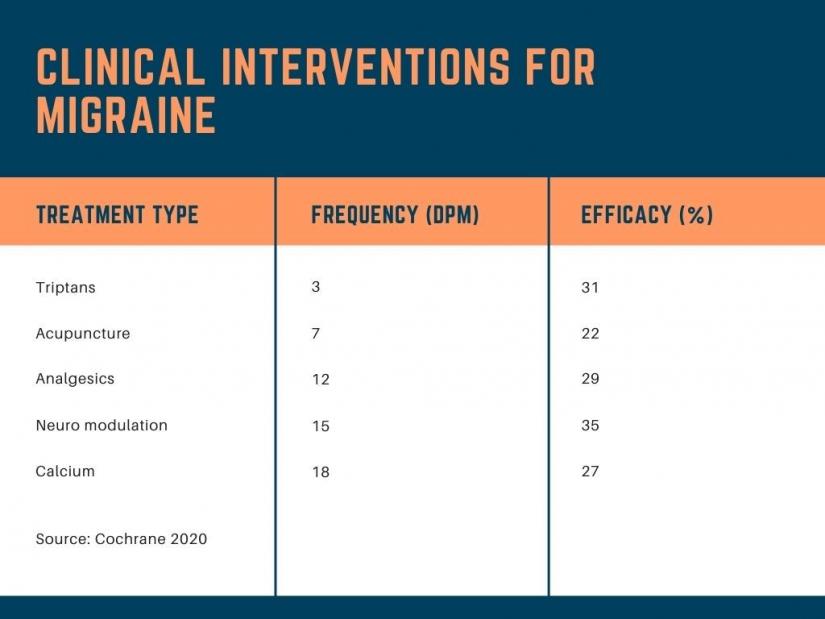
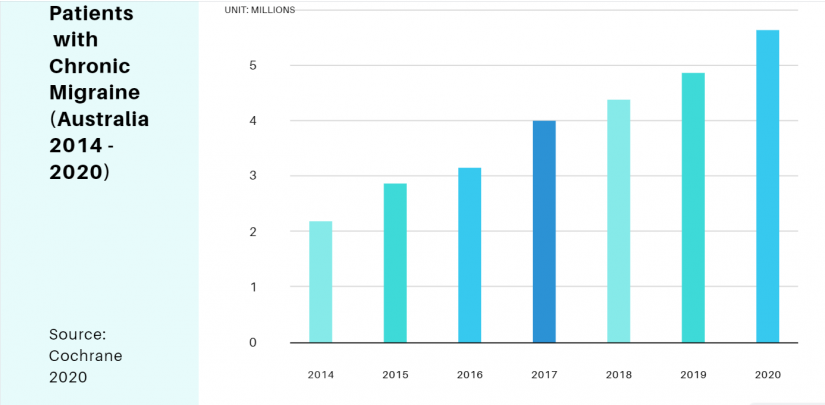
Table 1 shows clinical intervention ranked according to frequency and effectiveness. The overall results clearly demonstrate that migraine interventions are considered minimally efficacious regardless of the prescribed medication or therapy. Of particular concern, the incidence of clinically reported migraine episodes has been increasing in Australia over the past decade. As shown in Figure 2, the number of people suffering from chronic migraines has more than doubled over the last 7 years. Furthermore, over 80% of migraine sufferers reported that migraines severely affect their quality of life, while nearly three quarters of those surveyed indicated that it negatively impacts their professional duties. Notably, most patients would prefer alternative drug-free interventions, particularly those that experience adverse medical events and long-term side effects. This is particularly evident based on qualitative data whereby many patients describe their experience using medications as “life disrupting”, “untenable” and “unsafe” (Sotir, 2020). These comments provide further evidence that there is no universally acceptable treatment.

[Table 1]  It’s best to refer directly to any figures or tables rather than including them in brackets at the end of the sentence. Explain what they show, but save your interpretation of the findings for the ‘Discussion’ section.

[has more ... the last] You should focus on any notable trends or patterns indicated by the research.

[This is particularly...(Sotir, 2020)] If your research involved interviewing or surveying people, it can be useful to include brief quotes from the interviewees to help demonstrate some of the main findings.

table 1
Figure1

Table 1: Treatment Type, Frequency and Efficacy of Migraine Interventions

All tables and figures should be numbered and have a concise title which makes clear what information it contains.

Figure 2: Number of Patients with Chronic Migraine (2014-2020)

If a figure is taken from another source, you must cite the source just as you would a quote or paraphrase. Check out the UTS Library referencing guides for more information on how to reference figures and graphs according to different referencing styles.

Discussion

The results of this research are consistent with previous studies conducted in other countries. In fact, 82% of respondents who stated that migraines severely impact their life is remarkably similar to the results from studies conducted in Japan (Tanaka et al., 2017) and Italy (Perrini, 2015). One area where this research differs, however, is the inclusion of patients aged 18 years and under. It is apparent from the quantitative data in Table 1 and Figure 2, together with the qualitative data compiled, that chronic migraine is a persistent and recurring neurological issue for which no single intervention is superior to the other. However, it is acknowledged that certain treatments may be efficacious for patients on a case-by-case basis. According to estimates from Headache Australia (2019), over 5 million Australians suffer from migraine with an annual economic cost of $45 billion. This is clearly a medical issue that far surpasses any other disease in terms of its impact and thus warrants a concerted effort to reduce the debilitating effects that impinge on patients’ quality of life and the healthcare system.

[The results ... countries] Compares the findings from this research with other studies that have been conducted on this topic.

[One area ...differs] Describes both similarities and differences between these results and the results of previous research.

[that chronic migraine ... the other] Draws conclusions from the research findings, which requires the writer’s opinion based on their interpretation of the data.

[This is clearly ... healthcare system] Analyses the consequences or implications of the data presented, which may then lead to a separate section making recommendations based on this analysis.

Presenting data

Ask yourself the following questions whenever you are presenting data in your assignment. Click on each question below for more details.

How do I report the results?

1. Only present the most significant results. You do not need to describe all of your data in the text.

e.g. The overall results clearly demonstrate that migraine interventions are considered minimally efficacious regardless of the prescribed medication or therapy.

2. If necessary, large volumes of data may be included in a separate section entitled “Appendix” at the end of your document, and can be referred to in the text.

e.g. A notable feature of the survey responses was the consistency with which respondents referred to chronic migraines as reducing the quality of their life (see Appendix A for the full list of survey responses).

3. Refer clearly to tables/graphs/charts/images in your text.

e.g. Table 1 shows clinical interventions ranked according to frequency and efficacy, based on quantitative and qualitative data obtained from the systematic review and meta-analyses.

4. Distinguish between qualitative and quantitative data.

  • Quantitative data describes quantity, so it expresses number, amount or range.

e.g. In fact, 82% of respondents who stated that migraines severely impact their life is remarkably similar to the results from studies conducted in Japan (Tanaka et al., 2017) and Italy (Perrini, 2015).

  • Qualitative data describes how people experience something, so it looks at the quality rather than the amount.

e.g. This is particularly evident based on qualitative data whereby many patients describe their experience using medications as “life disrupting”, “untenable” and “unsafe” (Sotir, 2020).

How do I interpret the results?

1. Discuss the significance of the results based on your interpretation or evaluation.

e.g. This is clearly a medical issue that far surpasses any other disease in terms of its impact and thus warrants a concerted effort to reduce the debilitating effects that impinge on patients’ quality of life and the healthcare system.

2. Integrate findings from various sources to explore the topic in more depth.

e.g. It is apparent from the quantitative data in Table 1 and Figure 2, together with the qualitative data compiled, that chronic migraine is a persistent and recurring neurological issue for which no single intervention is superior to the other.

3. Connect your results to other research.

e.g. The results of this research are consistent with previous studies conducted in other countries. For example…..

What language should I use when describing data?

1. Select the correct verb tense when writing about your data.

VERB TENSE EXAMPLE SENTENCE EXPLANATION
Present perfect (continuous/progressive)

Of particular concern, the incidence of clinically reported migraine episodes has been increasing in Australia over the past decade.

Describes an event or action that started in the past and has been continuing up to now.

Present simple

The results clearly demonstrate that migraine interventions are considered minimally efficacious regardless of the prescribed medication or therapy.

Describes a fact, or provides an interpretation or opinion.
Past Simple

Furthermore, over 80% of migraine sufferers reported that migraines severely affect their quality of life, while nearly three quarters of those surveyed indicated that it negatively impacts their professional duties.

Describes an action that took place previously or explains the results of an investigation or analysis.

2. Use appropriate reporting verbs to indicate where the information came from.

e.g. According to estimates from Headache Australia (2019), over 5 million Australians suffer from migraine with an annual economic cost of $45 billion.

Here is a list of common reporting verbs used in academic writing.

3. Use cautious or tentative language to indicate that other research may provide contradictory findings, or that others may interpret the data differently from your interpretation.

e.g.  However, it is acknowledged that certain treatments may be efficacious for patients on a case-by-case basis.
Based on the data presented, it is likely that housing prices will continue to rise for the foreseeable future.

Want to learn more?

  • Linked In Learning has a series of videos on reporting data. All UTS students can access LinkedIn Learning free via the UTS Library.

Want some feedback on you report?  
CONTACT HELPS


Back to top

Acknowledgement of Country

UTS acknowledges the Gadigal People of the Eora Nation and the Boorooberongal People of the Dharug Nation upon whose ancestral lands our campuses now stand. We would also like to pay respect to the Elders both past and present, acknowledging them as the traditional custodians of knowledge for these lands. 

University of Technology Sydney

City Campus

15 Broadway, Ultimo, NSW 2007

Get in touch with UTS

Follow us

  • Instagram
  • LinkedIn
  • YouTube
  • Facebook

A member of

  • Australian Technology Network
Use arrow keys to navigate within each column of links. Press Tab to move between columns.

Study

  • Find a course
  • Undergraduate
  • Postgraduate
  • How to apply
  • Scholarships and prizes
  • International students
  • Campus maps
  • Accommodation

Engage

  • Find an expert
  • Industry
  • News
  • Events
  • Experience UTS
  • Research
  • Stories
  • Alumni

About

  • Who we are
  • Faculties
  • Learning and teaching
  • Sustainability
  • Initiatives
  • Equity, diversity and inclusion
  • Campus and locations
  • Awards and rankings
  • UTS governance

Staff and students

  • Current students
  • Help and support
  • Library
  • Policies
  • StaffConnect
  • Working at UTS
  • UTS Handbook
  • Contact us
  • Copyright © 2025
  • ABN: 77 257 686 961
  • CRICOS provider number: 00099F
  • TEQSA provider number: PRV12060
  • TEQSA category: Australian University
  • Privacy
  • Copyright
  • Disclaimer
  • Accessibility