


Data and analytics are transforming the NBA, helping players refine their training regimes and on-court strategies.
The Thunder haven’t always been championship contenders. Four years ago, in the 2020-2021 season, they barely won a quarter of their games. One matchup they lost by a staggering 73 points.
Since then they’ve steadily increased their win rate – and their rankings. Last season they broke through to the playoffs, only to have a heartbreaking elimination in the second round.
This year they went all the way. When the final buzzer sounded in Game 7 of the finals, they’d convincingly beaten the Indiana Pacers 103 to 91, bringing the championship trophy to Oklahoma City for the first time.
Featured Alumni

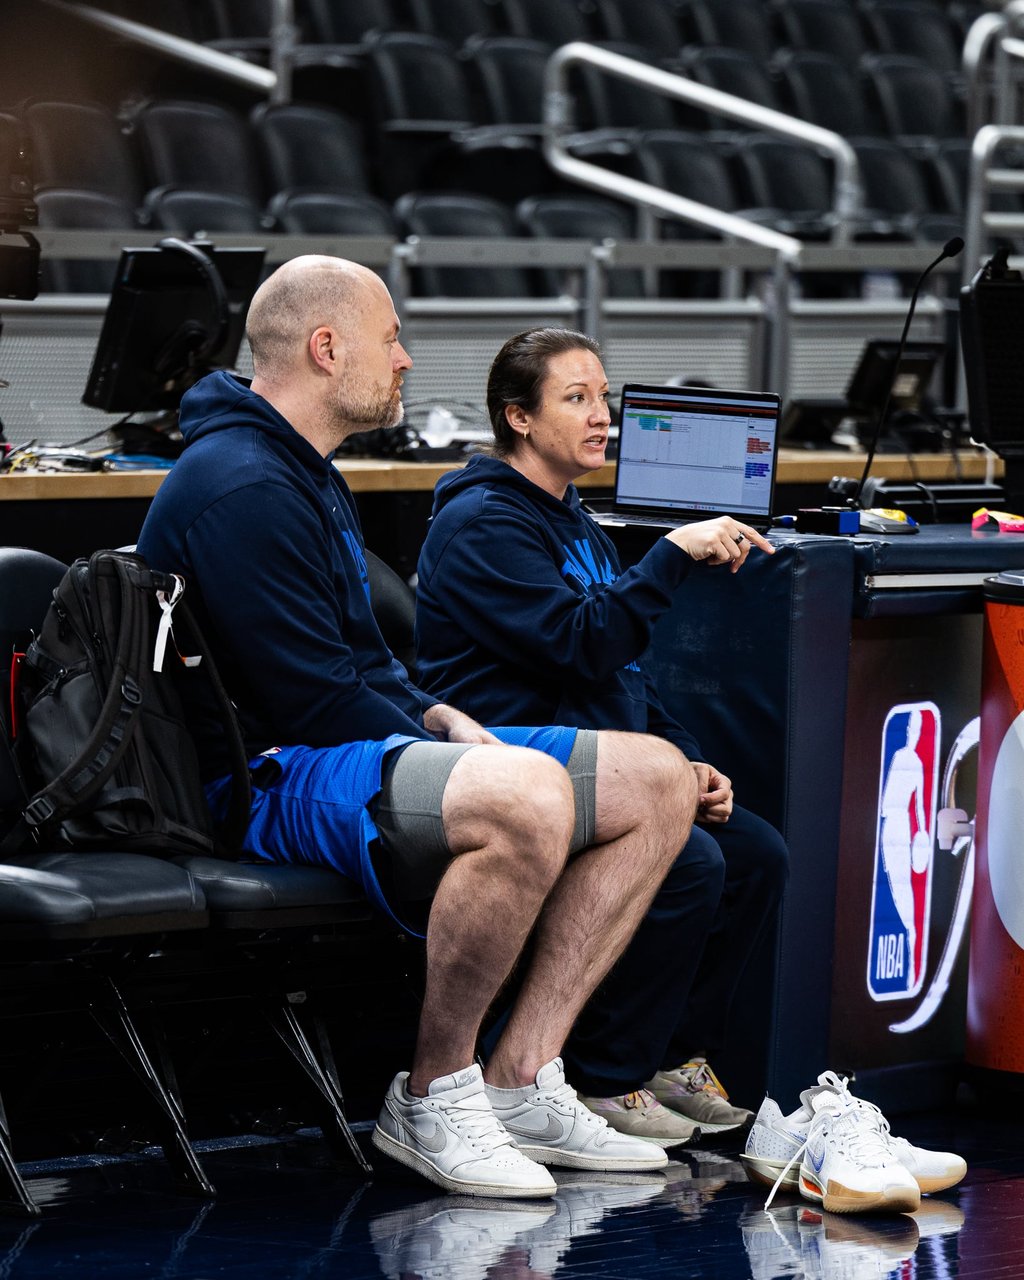
Dr Jenny Strickler
publishes under Dr Jenny Russell
Performance Scientist with the Oklahoma City Thunder
There’s no perfect science. There’s no magic number. There’s just information you can use to inform your decisions.
Running the numbers
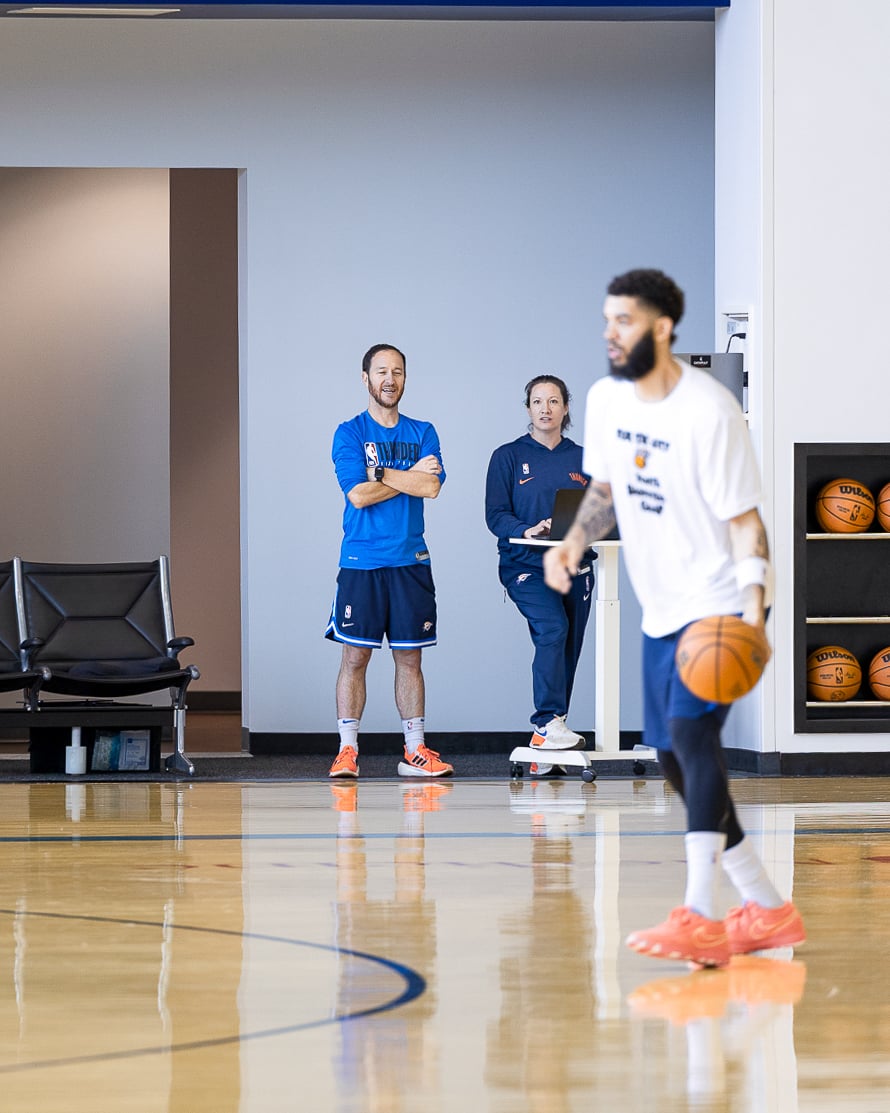
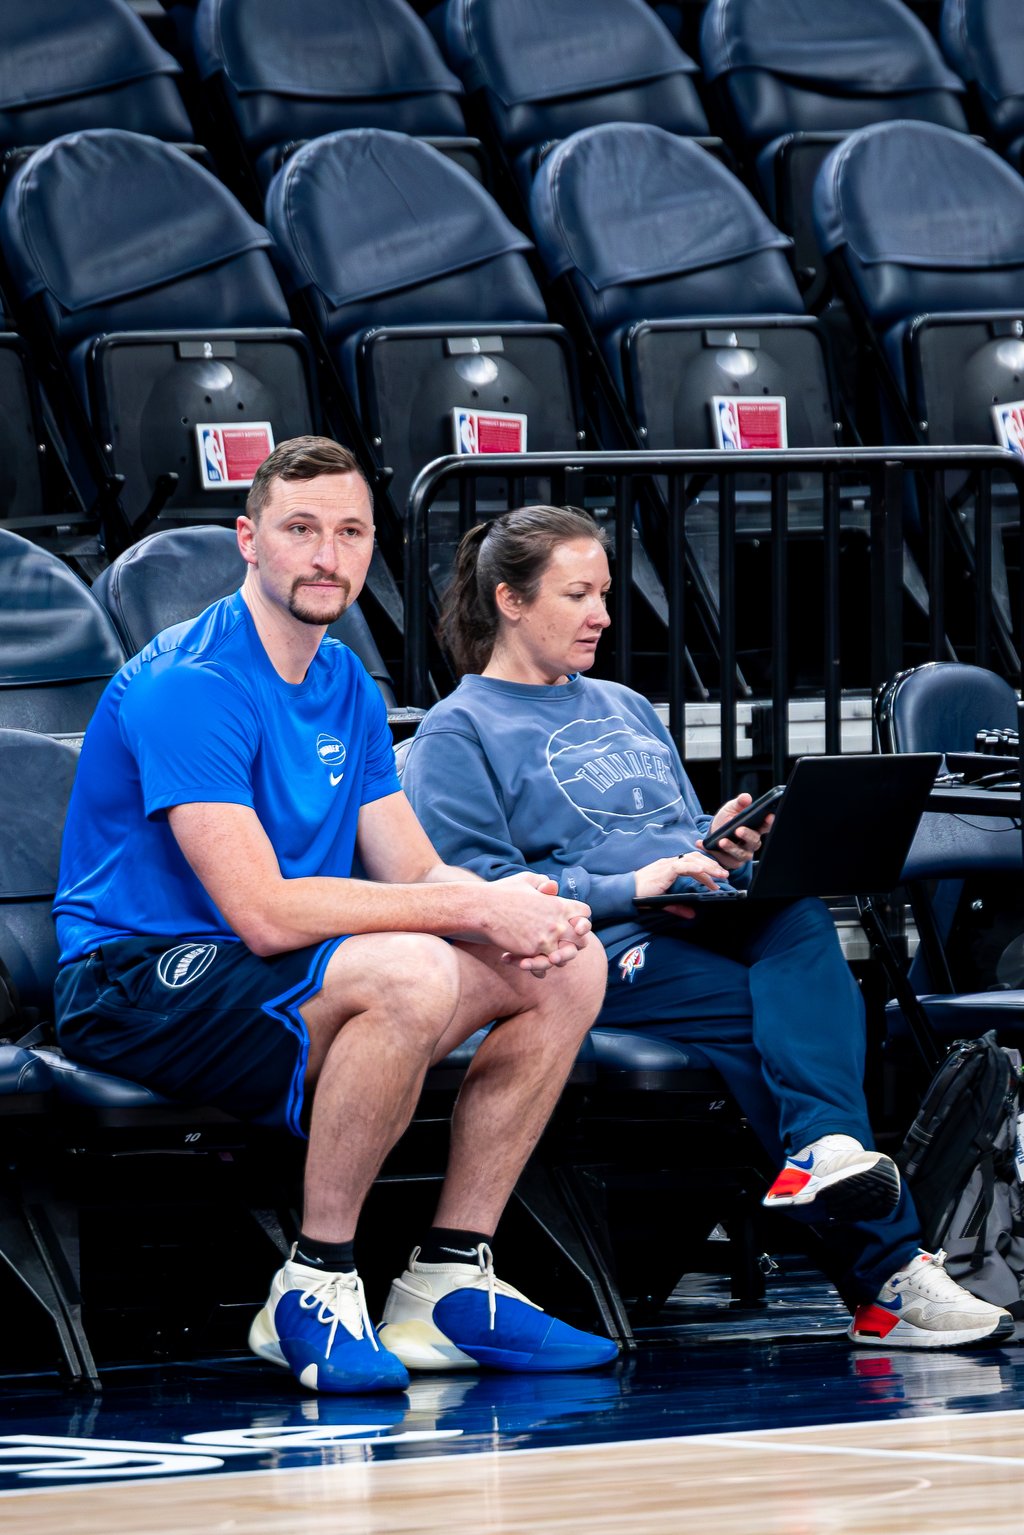
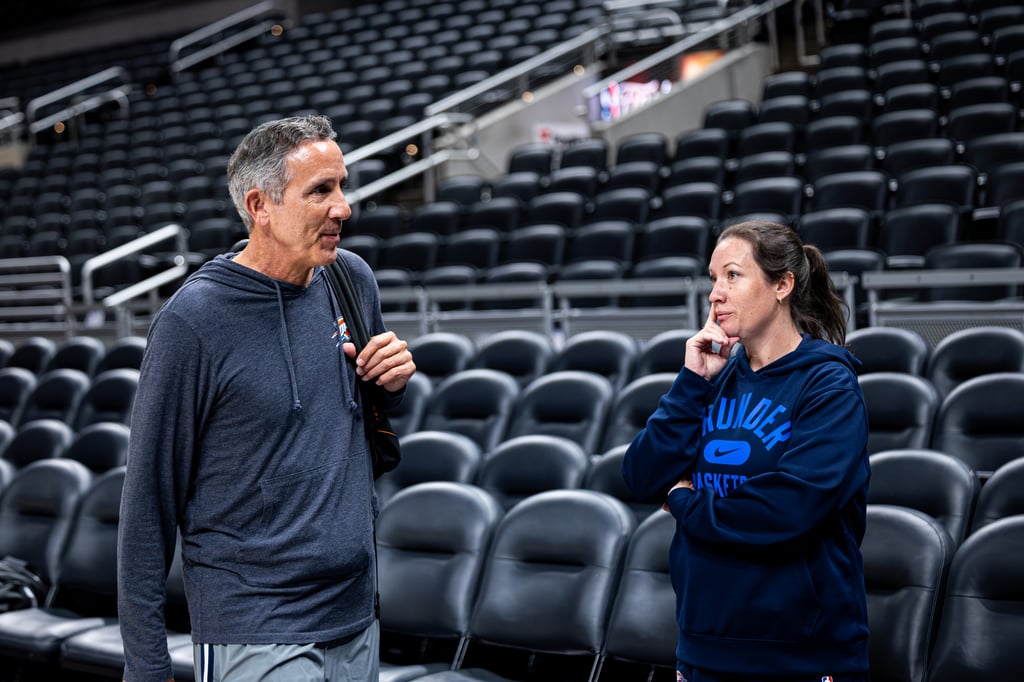
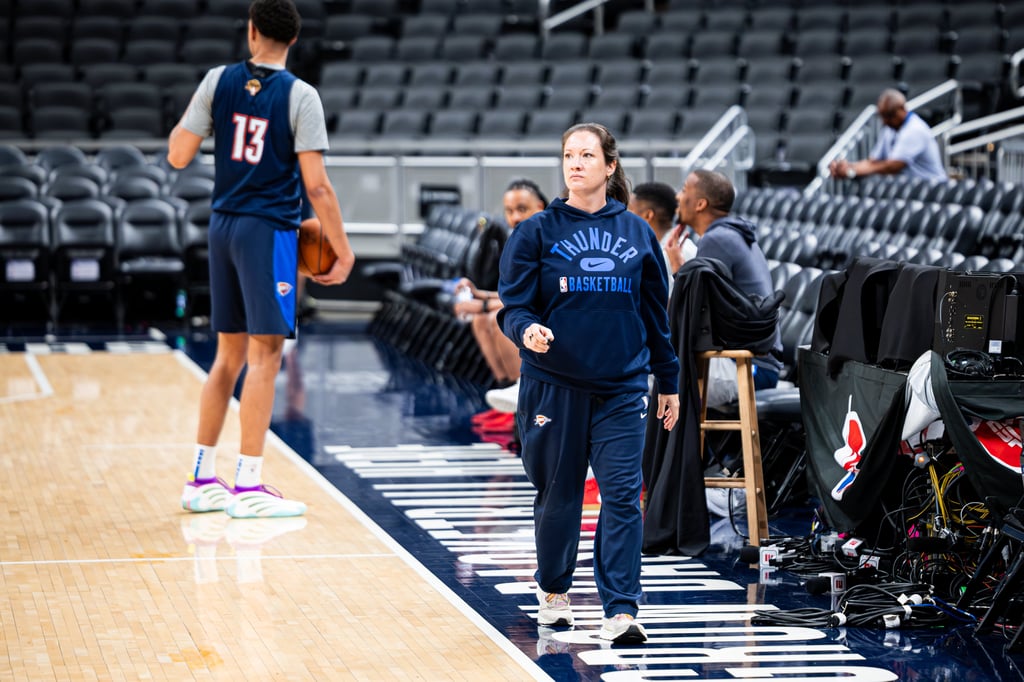
Dr Jenny Strickler started with the Thunder as a training camp intern for the 2015-16 season. Five years later she completed her PhD in sport and exercise science at UTS. Now she’s their Director of Performance Science, where her job is to collect, analyse and report on any data related to players’ physical health and performance.
“Most of what I do focuses on how we manage what they’re doing on court to maximise output and health throughout the season.”
To do this requires considering a multitude of datapoints: distance and velocity from optical tracking and local positioning systems; accelerations, decelerations, changes in direction from inertial measurement units; kinematic information (that is, data on how things move) through motion-capture assessments and kinetic information (why things move) through force plate data. Add to this body composition, metabolic profiling, strength testing, table testing with medical staff. The list goes on.
Taken together, all this information is used to paint a picture of what a player can achieve on the court, contrasted against points of stress that could put their joints and muscles at risk.
“It’s striking a balance between what they need to do to perform and what they need to do to prevent injury and stay available.”
A dynamic system
The challenge is that none of this takes place in a static environment. Players evolve and change. They get injured and benched, meaning others need to step up to fill the gap.
“Each player is dealing with different types of health or performance concerns,” says Strickler. “So it’s understanding how the dosing needs to be managed throughout the season.”
To do this, she considers the physical stresses players are undergoing off the court as well as on. Taking into account their training in the weight room, joint function and range of movement, layering in travel and the impacts of jetlag, timezone changes and recovery windows all helps with this understanding.
“There’s no perfect science. There’s no magic number. There’s just information you can use to inform your decisions.”
268
Duration of days in the Oklahoma City Thunder’s 2025 season, including playoffs (176 days regular season)
The cost of success
The other challenge is the NBA’s gruelling schedule. During the regular season, which runs for 176 days, teams play at least three games per week.
Then, they enter the postseason, with qualifying teams progressing through the playoffs. This is what everyone wants, but it extends an already long season, placing greater demands on the players, the staff, everyone.
By the time the Thunder and Pacers got to Game 7, they’d been going for 268 days.
For Strickler, this means two things. One is “keeping a very big picture in mind, in the hope that we can sustain this type of physical output for 268 days.”
The second is breaking the schedule down into manageable pockets, helping the coaches understand what they need to achieve to support players’ health now and their performance later.
“A lot of what I do is just make sure the guys are getting the training they need to be able to periodise effectively for the whole season.”
Putting research into practice
These are the challenges of applying research in a live sporting environment – finding continuity among so many moving parts. It’s a theme that ties back to Strickler’s doctorate.
“The thing that I appreciated the most about the PhD was the rigour. When you’re an academic researcher you’re trying to set things up so you can get it past a reviewer. In applied research you’re trying to set things up to get the same information to a coach over the course of 10 years.”
The aim, she says, is to create systems that allow you to evaluate your processes, assessing what went well and what could be improved upon.
“You’re almost always in an audit process of: how do we do things better, or what do we keep the same? What do we think is going to lead to success or improvement?”
The data boom
Performance science and data analytics have grown significantly since Strickler first joined the Thunder.
“When I started school, this was not even a career path that I knew about.”
The field has evolved quickly, she says, with more specialties emerging and increasing amounts of data available.
“In terms of the season it’s never-ending data input. It’s just: how much can you keep up with?”
In applied research you’re trying to set things up to get the same information to a coach over the course of 10 years.
Making connections
The Thunder has changed a lot in this time too. They lost some of their key players around the time Strickler came on board, meaning they needed to rebuild their roster, recruiting what has since become their star lineup.
Over the last five years these players have coalesced into a championship team, their energy and flair matched by the continuity they’ve found in the coaching and training staff.
“I don’t think we’re doing any of the data collection differently to any other team,” says Strickler, “but what we do at a very high level is the data connection.”
Here, it’s about getting the right information in the hands of the right people, and the trust that means those people actually use it.
“I started with a strength and conditioning coach at our G League team who’s now our director of rehabilitation and performance,” she continues. “And I started with a head coach at the G League team who’s now our head coach of the Thunder.
“We have grown up in this space together and built that trust over a decade.”
2.15
Average number of days between games – meaning three games per week, sometimes four
Winning the title
The Thunder’s championship run has been built on the hard work of many.
“What I realised when we won was just how many years of work had to go into something like that,” reflects Strickler. “How many refinements of processes across multiple people in an organisation had to click at the right time.”
Now that they have won, however, those processes are being put to new tests. Usually the team has a 12-week off-season to focus on player development, but their successful playoff run limited the time they had this year.
Strickler is up for the challenge.
“The thing that gets me excited about work every day is the fact that there’s always going to be a new and unique problem to solve.
“A lot of what we’re building is systems that are going to outlast the people and processes that are going to help cement a legacy.”
Dr Strickler's analysis on how basketball players spend their on-court time
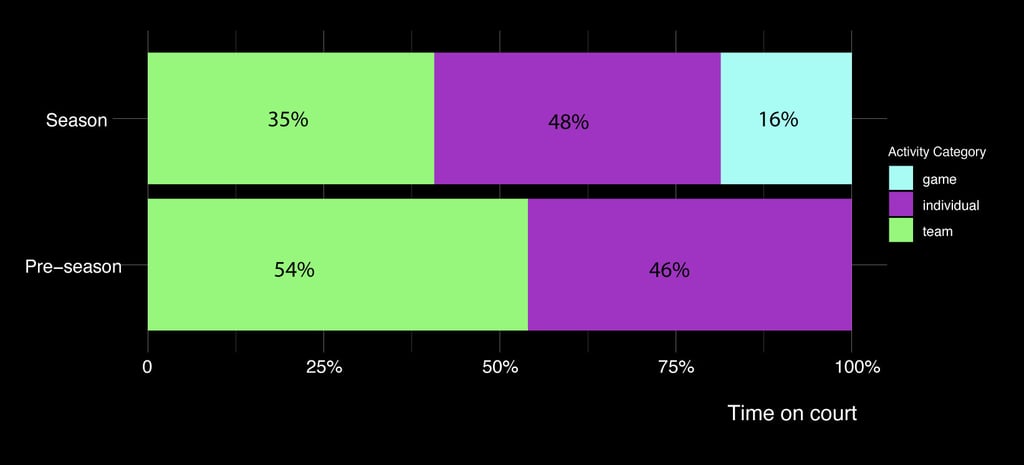
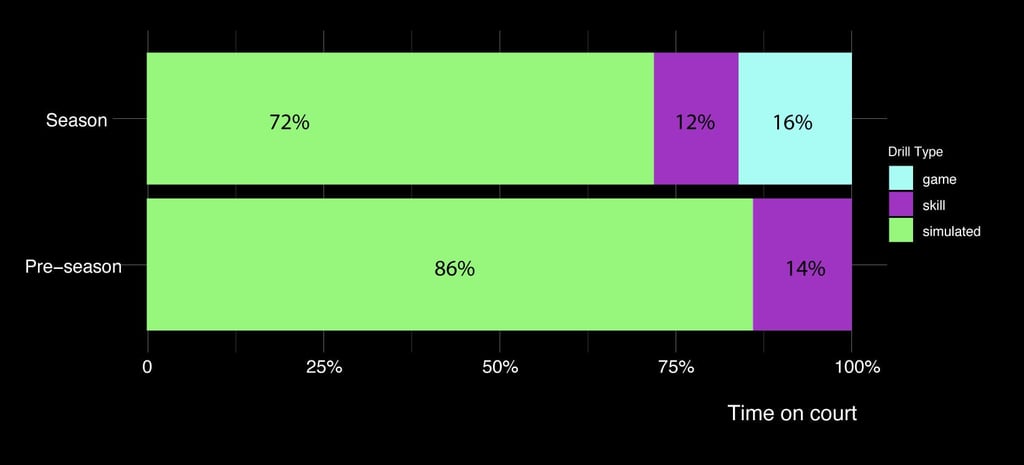
*Game=any league competitive event; Team=basketball-specific court work done as a team, Individual=court work not done with the team, Simulated=predominantly non-scripted drills, focused on game-like physical contact, pace, and situations, Skill=predominantly scripted drills with limited physical contact, focused on skill development.
Russell Jennifer L., McLean Blake D., Stolp Sean, Strack Donnie, Coutts Aaron J. Quantifying Training and Game Demands of a National Basketball Association Season. Frontiers in Psychology, Volume 12 - 2021, 10.3389/fpsyg.2021.793216
Story
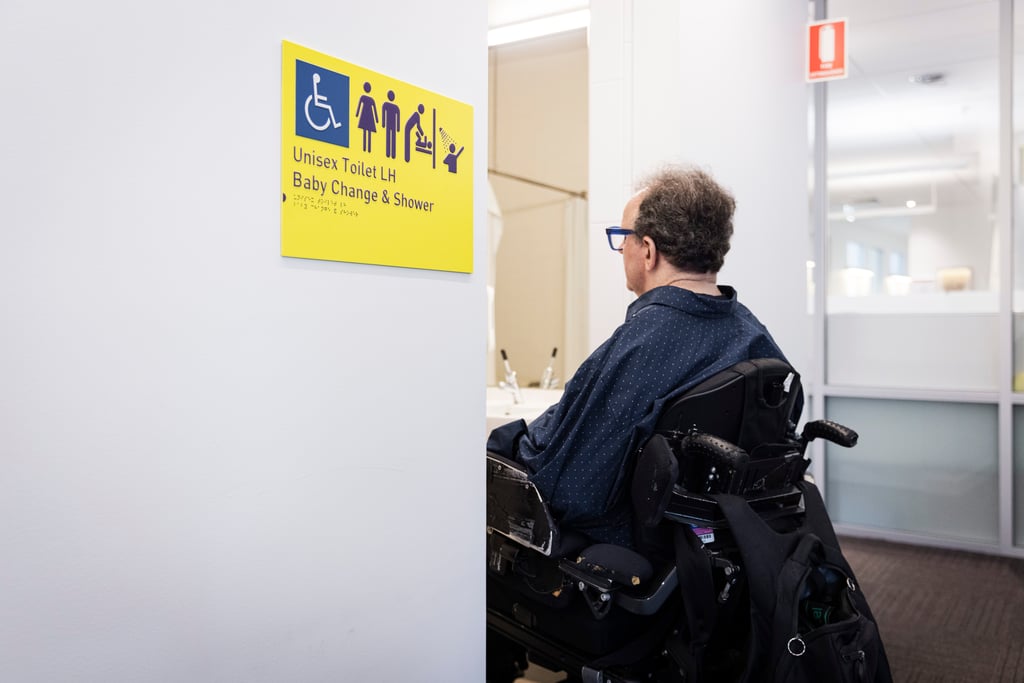
Inclusive by co-design
How UTS researchers are combining lived experience and real-world data to rethink accessible bathroom design.

Story
Behind the scenes of an award-winning animation
At Animal Logic Academy, students are just learning how to draw – they're part of an award-winning animation studio that's at the forefront of Australia's...

Story
Building automation
Robots powered by artificial intelligence are revolutionising the construction industry.
Story
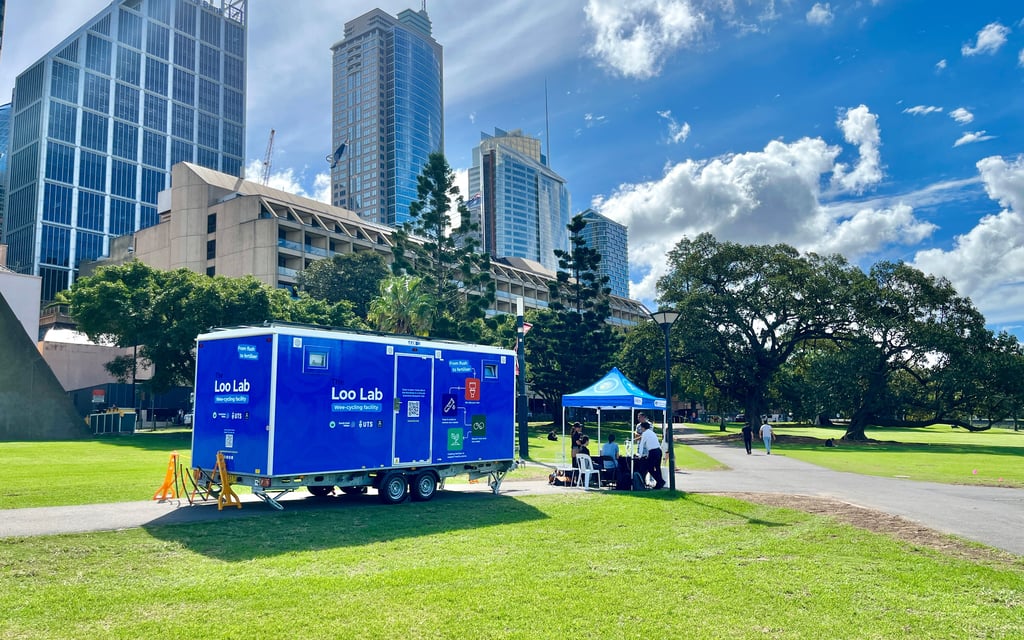
Liquid gold
The NiCE Loo uses advanced water filtration to turn urine waste into valuable fertiliser and help our sewerage system work more efficiently.
Story
Inclusive by co-design
How UTS researchers are combining lived experience and real-world data to rethink accessible bathroom design.
Story
Behind the scenes of an award-winning animation
At Animal Logic Academy, students are just learning how to draw – they're part of an award-winning animation studio that's at the forefront of Australia's...
Story
Building automation
Robots powered by artificial intelligence are revolutionising the construction industry.
Story
Liquid gold
The NiCE Loo uses advanced water filtration to turn urine waste into valuable fertiliser and help our sewerage system work more efficiently.