
Site navigation

  • University of Technology Sydney home
  • Home

    Home
  • For students

  • For industry

  • Research

Explore

  • Courses
  • Events
  • News
  • Stories
  • People

For you

  • Libraryarrow_right_alt
  • Staffarrow_right_alt
  • Alumniarrow_right_alt
  • Current studentsarrow_right_alt
  • Study at UTS

    • arrow_right_alt Find a course
    • arrow_right_alt Course areas
    • arrow_right_alt Undergraduate students
    • arrow_right_alt Postgraduate students
    • arrow_right_alt Research Masters and PhD
    • arrow_right_alt Online study and short courses
  • Student information

    • arrow_right_alt Current students
    • arrow_right_alt New UTS students
    • arrow_right_alt Graduates (Alumni)
    • arrow_right_alt High school students
    • arrow_right_alt Indigenous students
    • arrow_right_alt International students
  • Admissions

    • arrow_right_alt How to apply
    • arrow_right_alt Entry pathways
    • arrow_right_alt Eligibility
arrow_right_altVisit our hub for students

For you

  • Libraryarrow_right_alt
  • Staffarrow_right_alt
  • Alumniarrow_right_alt
  • Current studentsarrow_right_alt

POPULAR LINKS

  • Apply for a coursearrow_right_alt
  • Current studentsarrow_right_alt
  • Scholarshipsarrow_right_alt
  • Featured industries

    • arrow_right_alt Agriculture and food
    • arrow_right_alt Defence and space
    • arrow_right_alt Energy and transport
    • arrow_right_alt Government and policy
    • arrow_right_alt Health and medical
    • arrow_right_alt Corporate training
  • Explore

    • arrow_right_alt Tech Central
    • arrow_right_alt Case studies
    • arrow_right_alt Research
arrow_right_altVisit our hub for industry

For you

  • Libraryarrow_right_alt
  • Staffarrow_right_alt
  • Alumniarrow_right_alt
  • Current studentsarrow_right_alt

POPULAR LINKS

  • Find a UTS expertarrow_right_alt
  • Partner with usarrow_right_alt
  • Explore

    • arrow_right_alt Explore our research
    • arrow_right_alt Research centres and institutes
    • arrow_right_alt Graduate research
    • arrow_right_alt Research partnerships
arrow_right_altVisit our hub for research

For you

  • Libraryarrow_right_alt
  • Staffarrow_right_alt
  • Alumniarrow_right_alt
  • Current studentsarrow_right_alt

POPULAR LINKS

  • Find a UTS expertarrow_right_alt
  • Research centres and institutesarrow_right_alt
  • University of Technology Sydney home
Explore the University of Technology Sydney
Category Filters:
University of Technology Sydney home University of Technology Sydney home
  1. home
  2. arrow_forward_ios ... Newsroom
  3. arrow_forward_ios ... 2020
  4. arrow_forward_ios 03
  5. arrow_forward_ios Exploring identity with data visualisation

Exploring identity with data visualisation

10 March 2020

When UTS Visual Communication student Rachel Tse started feeling disconnected from her Chinese heritage, she turned to her training in data visualisation to re-engage with her cultural identity.

Rachel Tse working at a desk in a light cafe setting


Seeking connection

It wasn’t until Rachel Tse moved to Australia that she felt the connection to her Chinese roots beginning to fray. 

Born and raised in Hong Kong, she completed her education in international schools mostly speaking English and studying a westernised curriculum. 

While she spoke Cantonese, she felt disconnected from the language – “I always thought, I’m going to move somewhere else anyway. I don’t need Chinese; it doesn’t matter to me,” she says – but it wasn’t until she arrived in Sydney that she realised just how much that disconnection had cost her. 

Losing a language is very much an emotional, psychological and sensitive process, but it’s also a quantitative one, so data visualisation seemed like an effective way to convey my ideas.

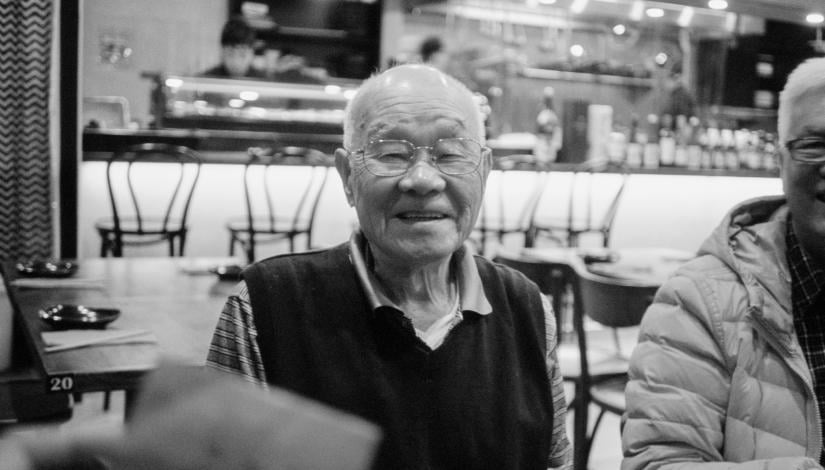
“I actually came here three years ago, and my grandpa who lived here didn’t speak English,” she says.

“I realised when I was speaking to him that I was using this broken Cantonese and I couldn’t really connect with him, and it just got really sad.” 

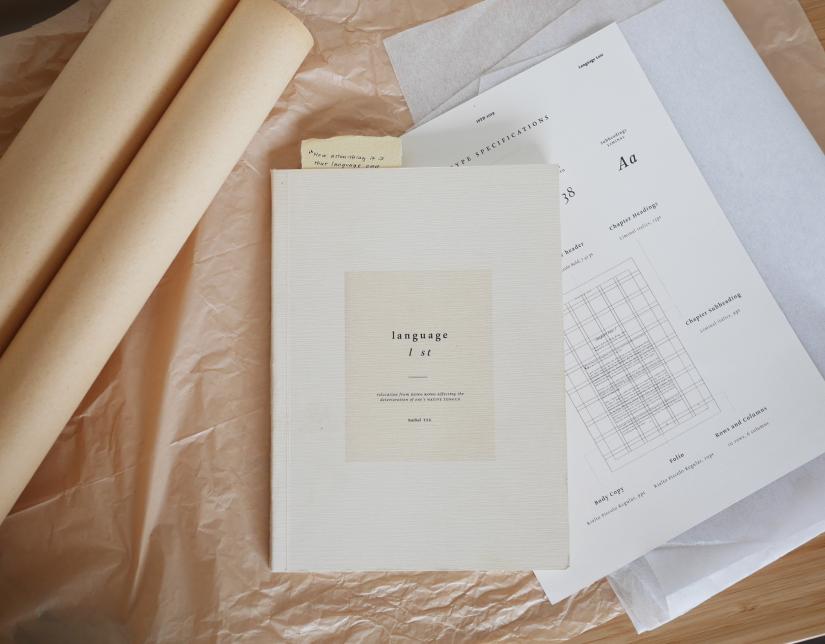
The experience was the foundation of Tse’s final year Design Practice project, which was exhibited at the Faculty of Design, Architecture and Building’s end of year show. Called Language L st, the work – a book – used data visualisation to explore the deeply personal impacts of losing her native tongue.

Black and white portrait of Rachel Tse's grandpa sitting in a cafe

Unable to speak the same language of her grandpa, Rachel Tse realised how much losing her native tongue had cost her. 


Using data visualisation to explore language

Tse begun her process by digging out an old Cantonese essay from school that she’d written in her early teen years and recruited nine participants to read it. Three were born and raised in Hong Kong, three were born in Hong Kong but migrated to another country, and three were born and raised in a western country to Chinese parents. 

Each participant was asked to circle the Chinese characters they recognised. Tse, who says she could barely understand the essay herself, then used the results to create a series of visual representations of the results.

What is data visualisation? As well as being a growing field in design, Rachel says it's "a visual strategy that uses the mapping of data values and information to understand patterns and data relationships." 

Tse presented the first set of results a set of diagrams that charted the number of words understood by each group on a circular graph. The second was a recreation of the essay itself – for each group, Tse reproduced the Cantonese characters that participants had recognised and removed those they hadn’t. Those born and raised in Hong Kong had a strong understanding of the text, but for those who migrated to or were born in other countries, the loss of language was clearly visible on the page. 

“When I read Chinese, there’s lots of skipping words, because I don’t know many characters, so I wanted to convey that feeling,” Tse says.  

“As the book goes along, the letters break apart and at the very end the story is almost illegible.”

The Cantonese characters were printed in a font that was formerly used in Hong Kong signage but – in symbolic twist – is rapidly dying out. Tse also used a mix of paper types to create a tactile experience for the reader, and illustrated the book with black and white images of her homeland.

Drawing from the breadth of visual communication 

Creating Language L st called on Tse’s three years of study in the UTS visual communication degree. She says that the degree introduced her to a huge range of design concepts, from data visualisation training and visual narrative to illustration, typography and storytelling, that helped her expand her own creative practice.

“Visual communication is so broad and so practical, which is why I love it,” she says.

“If you don’t know what you want to do, I feel like it’s such a great place to start.  

“Within my cohort, we’re all graduating with the same degree, but everyone has such different skills – I like print design, but my friend does all this digital web media stuff and then another friend does coding.”

Rachel Tse's book Language L st lays on papers including a type specifications document

The Cantonese characters in Language L st were printed in a font that was formerly used in Hong Kong signage but – in symbolic twist – is rapidly dying out. 


What’s next for Rachel Tse?

Now that she’s finished her studies, Tse says the next step will be starting to look for work as a graphic designer. For now, she seems content to stay put in Australia. 

But even from a distance, the experience of making Language L st has pushed her to be more proactive about her own language and cultural connections – she now tries hard to speak Cantonese to her parents and relatives, rather than slipping back into the comfort and familiarity of English.

“I think they’re actually kind of shocked by it whenever I do!” she says.   
 

Learn more about the UTS Bachelor of Design in Visual Communication.


Byline

Claire Thompson
Share
Share this on Facebook Share this on Twitter Share this on LinkedIn
Back to News in Design, Architecture and Building

Related News

  • Banner mockup of Beth Sacco's thanksmate campaign
    Road safety design with a soft touch
  • UTS Visual Communication students with their clients from Reverse Garbage
    One person’s trash? A designer’s treasure
  • Living with the Locals video animation still
    Designers' videos bring Indigenous history to life

Acknowledgement of Country

UTS acknowledges the Gadigal People of the Eora Nation and the Boorooberongal People of the Dharug Nation upon whose ancestral lands our campuses now stand. We would also like to pay respect to the Elders both past and present, acknowledging them as the traditional custodians of knowledge for these lands. 

University of Technology Sydney

City Campus

15 Broadway, Ultimo, NSW 2007

Get in touch with UTS

Follow us

  • Instagram
  • LinkedIn
  • YouTube
  • Facebook

A member of

  • Australian Technology Network
Use arrow keys to navigate within each column of links. Press Tab to move between columns.

Study

  • Find a course
  • Undergraduate
  • Postgraduate
  • How to apply
  • Scholarships and prizes
  • International students
  • Campus maps
  • Accommodation

Engage

  • Find an expert
  • Industry
  • News
  • Events
  • Experience UTS
  • Research
  • Stories
  • Alumni

About

  • Who we are
  • Faculties
  • Learning and teaching
  • Sustainability
  • Initiatives
  • Equity, diversity and inclusion
  • Campus and locations
  • Awards and rankings
  • UTS governance

Staff and students

  • Current students
  • Help and support
  • Library
  • Policies
  • StaffConnect
  • Working at UTS
  • UTS Handbook
  • Contact us
  • Copyright © 2025
  • ABN: 77 257 686 961
  • CRICOS provider number: 00099F
  • TEQSA provider number: PRV12060
  • TEQSA category: Australian University
  • Privacy
  • Copyright
  • Disclaimer
  • Accessibility