The logic model in the TDM Technical Manual reads from left to right, with the System outcomes across the bottom to show how they are ‘foundations’ for the whole project.
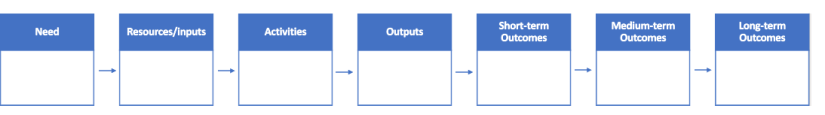
Figure 1: An example of an outcome chain
The same relationships can be represented in other ways: we could have arranged the flow from top to bottom or bottom to top.
Your choice about how to present your logic model will depend on how complex the project is and on feedback from your audience.
Box 1: The pipeline logic model as a starting point
The pipeline logic model is a very popular approach to presenting logic models. The pipeline logic model simply adds arrows between the boxes, and each of the boxes contains a list of the specific Resources, Activities, etc. that make up the project.
While very popular, there are some risks with the pipeline logic model if it is used simplistically or imposed as the only way to present the logic of a TDM project:
-
A simple listing of Outcomes and Impacts does not show how outcomes interact with each other
-
It is hard to show how the specific resources and activities will produce specific outcomes
-
It assumes that the flow of cause and effect is linear with all the work upstream and all the effects downstream, with no feedback loops or complex sequencing among them
-
It draws undue focus to the boxes on the left (since this is how we read), instead of the outcomes and impacts that should be the focus
-
Pipeline models also commonly break outcomes down into short-term, medium-term, and long-term (impacts are sometimes called long-term outcomes). Many projects do not fit this neat 3-step division. There is no particular reason why TDM projects should have 3 (and only 3) steps in the outcome chain. Some may produce their final outcomes directly in one step, while others may have several steps in the chain of logic.
Despite these limitations, a pipeline logic model can be a useful starting point as people find it easier to group similar things, such as activities, into a single box. If you, or other people involved in the project design and evaluation planning, find the pipeline model an easy way to start, you can then use it to create the elements for the 7-step process to developing logic models by following this procedure:
-
Print out a completed pipeline model and cut it up so that each of the specific elements are on a separate bit of paper. You might find it helpful to use different colored paper for each of the 5 boxes.
-
Take all the outcomes and organise them in a logical sequence according to how the project is intended to ‘work’. Some outcomes will sit together, while others will come earlier than others in the causal chain and others down the chain
-
Draw arrows connecting the outcomes that describe the causal logic, including any feedback loops.
-
If there are gaps in the logic add new outcomes
-
Link activities and resources to the relevant outcomes, noting that some of these may be relevant to multiple outcomes.
-
Identify any outputs that will emerge if each outcome is realized
Sometimes logic models can become too complex if there are many arrows criss-crossing each other to connect boxes in a diagram. To avoid this, you might consider only including the outcomes chain in the diagram, and to put complex interactions between outcomes and activities in a table, as illustrated in Table 1.
Table 1: Using a table to link activities and outcomes
|
|
Activity A |
Activity B |
Activity C |
Activity D |
... |
|---|---|---|---|---|---|
Final outcomes |
|||||
|
Outcome 1 |
X |
|
X |
|
|
|
Outcome 2 |
|
X |
X |
|
|
|
… |
|
|
|
|
|
Enabling outcomes |
|||||
|
Outcome 3 |
|
|
|
X |
|
|
Outcome 4 |
|
X |
|
X |
|
|
… |
|
|
|
|
|
You can also replace the X marks in Table 1 with written information, such as the rationale for using each activity to achieve the outcome(s) associated with it, the resources that will be used, and the outputs that will be generated.
If the project is very complex, or has many components, consider using more than one diagram to capture the logic. Several diagrams that let the project’s story unfold in layers of detail can be more informative. This is particularly the case where there are different audiences for the logic model.
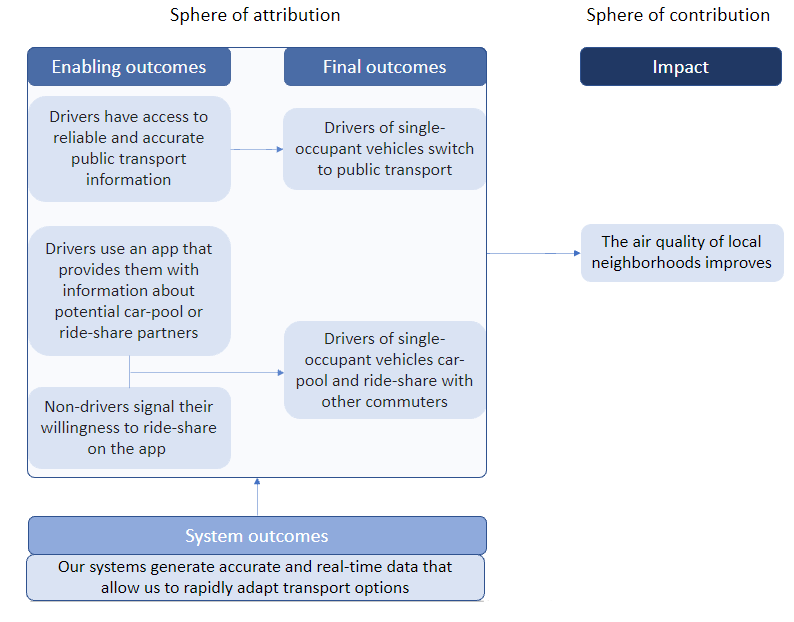
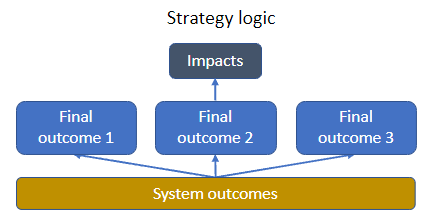
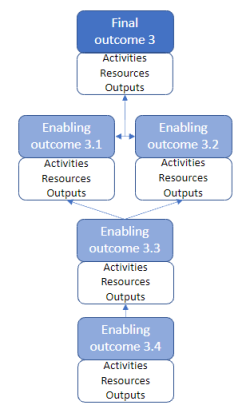
For example, you may use a high-level strategy logic to show the connections among the main components of a complex strategy such as in Figure 2. A series of separate nested program logics can then be presented that show the details for each element of the strategy logic. Figure 3 shows how Outcome 3, which appears as one box in the strategy logic, is then detailed in its own logic model, and there would be corresponding ones for each of the other final outcomes.
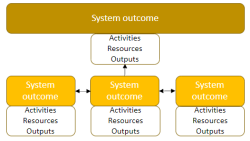
You can also have a separate system logic for the main internal changes to your agency or unit that ensure you can deliver the program (Figure 4).
-
Figure 2: A high-level strategy logic
-
Figure 3: A detailed program logic
-
Figure 4: A detailed system logic