

- Posted on 18 Aug 2023
- Updated on 18 Aug 2023
- 11-minute read
[R]E Space – Renewable Energy Potential under Space-Constraint Conditions
Data | Assumptions | Source |
Land cover | Land cover classes, which are suitable for solar energy and wind energy production were identified from different land-cover maps respectively. see Appendix for detailed information. | All countries (except countries below): Copernicus Global Land Cover – 2019 USA: National Land Cover Database – 2019 Europe (EU27, UK, Turkey): Copernicus Corine Land Cover – 2018 Australia: Catchment scale land use of Australia – December 2020 |
Digital Elevation Model (DEM) | For both wind and solar analyses, any land with a slope ˃30% was eliminated from all scenarios. | EU27, UK, Japan: Multi-Error-Removed Improved-Terrain DEM Canada, USA: GMTED2010 |
Protected areas | All protected areas designated under national parks, wildlife reserves, hunting reserves, conservation area and buffer zones were eliminated from all scenarios. | The World Database on Protected Areas (WDPA) |
Solar irradiance (Direct normal irradiation: DNI) | The average yearly direct normal insolation/irradiation (DNI) values range from 1 to 5 MWh/m2 per year. | Global Solar Atlas |
Wind speed at 100m | Wind speeds ≥5 m/s were considered at a height of 100 m. | Global Wind Atlas |
Data | Solar energy | Wind energy |
Copernicus Global Land Cover 2019 (world) |
|
|
Corine Land Cover 2018 (Europe) |
|
|
National Land Cover Database 2019 (USA) |
|
|
Catchment scale land use of Australia 2020 (Australia) |
|
|
Data | Solar energy | Wind energy |
Copernicus Global Land Cover 2019 (world) |
|
|
Corine Land Cover 2018 (Europe) |
|
|
National Land Cover Database 2019 (USA) |
|
|
Catchment scale land use of Australia 2020 (Australia) |
|
|
Methodology
1. Solar Potential Areas and Onshore Wind Potential Areas
The primary purpose of GIS mapping is to identify indicative areas for future solar energy projects and onshore wind energy projects, and to project the renewable energy resources available in the Group of Twenty (G20) – Argentina, Australia, Brazil, Canada, China, France, Germany, India, Indonesia, Italy, Japan, the Republic of Korea, Mexico, Russia, Saudi Arabia, South Africa, Turkey, the United Kingdom (UK), and the United States of America (USA), and the European Union (EU). Mapping was performed with the software ESRI ArcGIS10.6.1. Both maps were developed respectively using the same methodology, but using different criteria. The areas of land available for potential solar and wind power generation were calculated and visualised by country/region using ArcGIS.
Open-source spatial data from various sources have been collected, processed and overlaid to develop (1) Solar Potential Area and (2) Onshore Wind Potential Area maps for all G20 member countries/region. The main data sources and assumptions made for this mapping are summarised in Table 1.
Table 1: GIS-mapping – data sources and assumptions
The mapping procedure is summarised for Solar Potential Area (Figure 1) and for Onshore Wind Potential Area (Figure 2). The procedures involved:
- Spatial data were obtained from various public sources, including land-cover maps (or land use maps), slope data generated from Digital Elevation Model (DEM), protected area maps, solar irradiation (Direct normal irradiation: DNI) and wind speed data (Table 1).
- The data was all converted into binary maps (0=Not potential area, 1= Potential area) against all assumptions (Table 1).
- All data was combined into one binary map by overlaying all the raster data. This map integrates all above criteria as one map having value 1 (included in potential area) or value 0 (not included in potential area) (Figure 1 & 2).
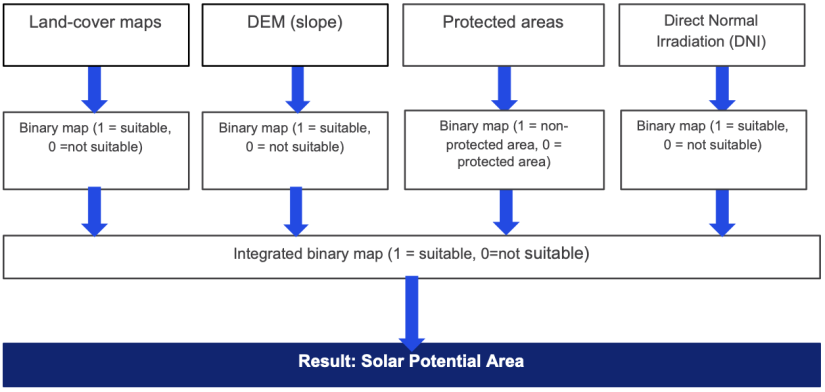
Figure 1: Solar Potential Area
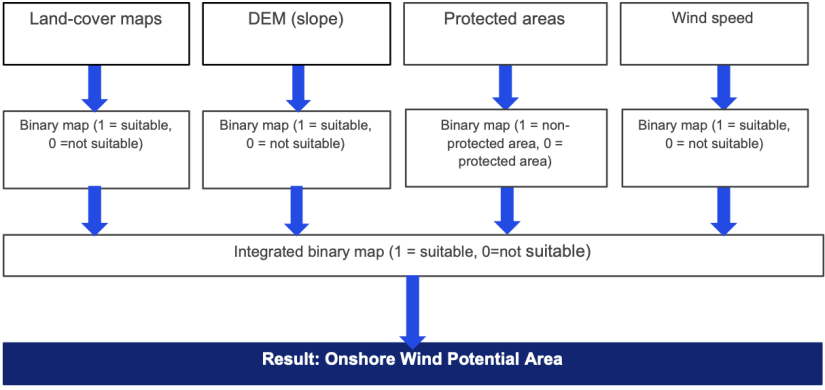
Figure 2: Onshore Wind Potential Area
2. Calculation of potential areas and energy potentials
The maps were prepared in raster with 250m x 250m cell. The indicative potential areas were calculated based on the count of the cells for all G20.
The solar energy potential was calculated for all G20 based on the identified Solar Potential Area and an assumption that the installed capacity per square kilometre is 25 MW on average
The onshore wind energy potential was calculated for all G20 based on the identified Onshore Wind Potential Area and the assumption that the average installed capacity per square kilometre is 5 MW.
Limitations
The maps address limitations due to requirements for further considerations of local contexts on each location. The maps can serve as indicative location maps.
The availability of solar irradiance for the area between 60°N to 45°S only.
Area calculations of both Solar Potential Areas (km2) and Onshore Wind Potential Areas (km2) provided in the maps may have a slight range (maximum ± 10 percent) due to the distortion of areas in the maps.
Data access
Data can be accessible upon request.
A/Prof. Dr Sven Teske | University of Technology Sydney, Institute for Sustainable Futures
e-mail: SvenTeske@uts.edu.au
Dr Saori Miyake | University of Technology Sydney, Institute for Sustainable Futures
e-mail: Saori.Miyake@uts.edu.au
Appendix
Land cover classes included for solar and wind energy areas:
Land-cover classes NOT included for solar and wind energy areas:
-
Solar and wind potential
Is there enough renewable energy?
Click here for Global Industry Classification Standard-based solar and onshore wind potential assessments for all countries and regions, and to download data.
Solar-potential map
Wind-potential map

Methodologies
Read about the different methodologies used to determine energy demand, supply, how to define Scope 1, 2 and 3 emissions and renewable energy potential assessments.
Dashboard
See the OECM 1.5°C pathways for countries and regions, and their industry sectors. Explore energy demand and supply developments until full decarbonisation in 2050.

Sectoral pathways
The OECM on the development of 1.5°C net zero pathways for industry sectors classified under the Global Industry Classification Standard (GICS).