

- Posted on 30 Aug 2024
- 6-minute read
Shifting transport from air and road to sea and rail has untapped potential to slash emissions writes Robin Smit.
Australian transport emissions are still growing. As a result, transport is expected to be our biggest-emitting sector by 2030. So, cutting transport emissions is crucial to Australia’s net-zero strategy.
Studies show electrifying passenger vehicles and trucks will greatly reduce greenhouse gas emissions. But the switch to electric vehicles is slow. It won’t be enough to reach net-zero by 2050.
Other strategies are needed. That’s where the concept of “mode shift” comes in. It involves shifting passengers and freight to lower-emission forms of transport such as electric rail and shipping.
In two new research papers, a colleague and I show what a big impact this could have on Australia’s emissions. We used the Inland Rail project linking Brisbane and Melbourne as a case study of the potential impacts of shifts between land-based transport, shipping and aviation. (The route comprises 12 sections, some already operational, some being built and others in the planning phase.) We modelled the total emissions of these modes for three years: 2019, 2030 and 2050.
We found electric rail is hands down the land transport mode with the lowest emissions intensity (the amount of greenhouse gas produced per kilometre travelled) for both passengers and freight. When we included air and sea transport, we found electric rail and shipping have the lowest emissions. Air transport in Australia is in a class of its own as its emissions performance is so much worse than other modes, particularly for freight.
It will be very hard to reach zero emissions in the transport sector in a timely fashion. To get there will require all hands on deck for the freight sector but also for personal travel and the choices we make.
How much difference can mode shifts make?
Current domestic emissions by transport mode are skewed. The vast bulk (85%) of total annual carbon-dioxide-equivalent (CO₂-e) emissions comes from road transport. It’s followed by air (8%), rail (4%) and sea (2%) transport.
To fairly assess performance, we used the well-to-wheel/wake approach. It includes both direct and indirect emissions from producing, distributing and using fossil fuels, hydrogen and electricity. We calculated these emissions for 2019, 2030 and 2050.
These figures do not yet include non-domestic emissions created by Australian aviation and shipping activities overseas. Including these will greatly increase total emissions from these modes.
For passengers, air transport had the highest emission intensity. It is an energy-intensive mode of transport and has climate effects in addition to those caused by its CO₂ emissions, as I outline below. Including these effects, we estimated air transport’s emission intensity to be 1.7 to 2.8 times higher than for road transport.
From an emissions perspective, high-speed electric rail is a great alternative to road and air transport for travel between capital cities. It would result in deep emission cuts varying from 75–95%.
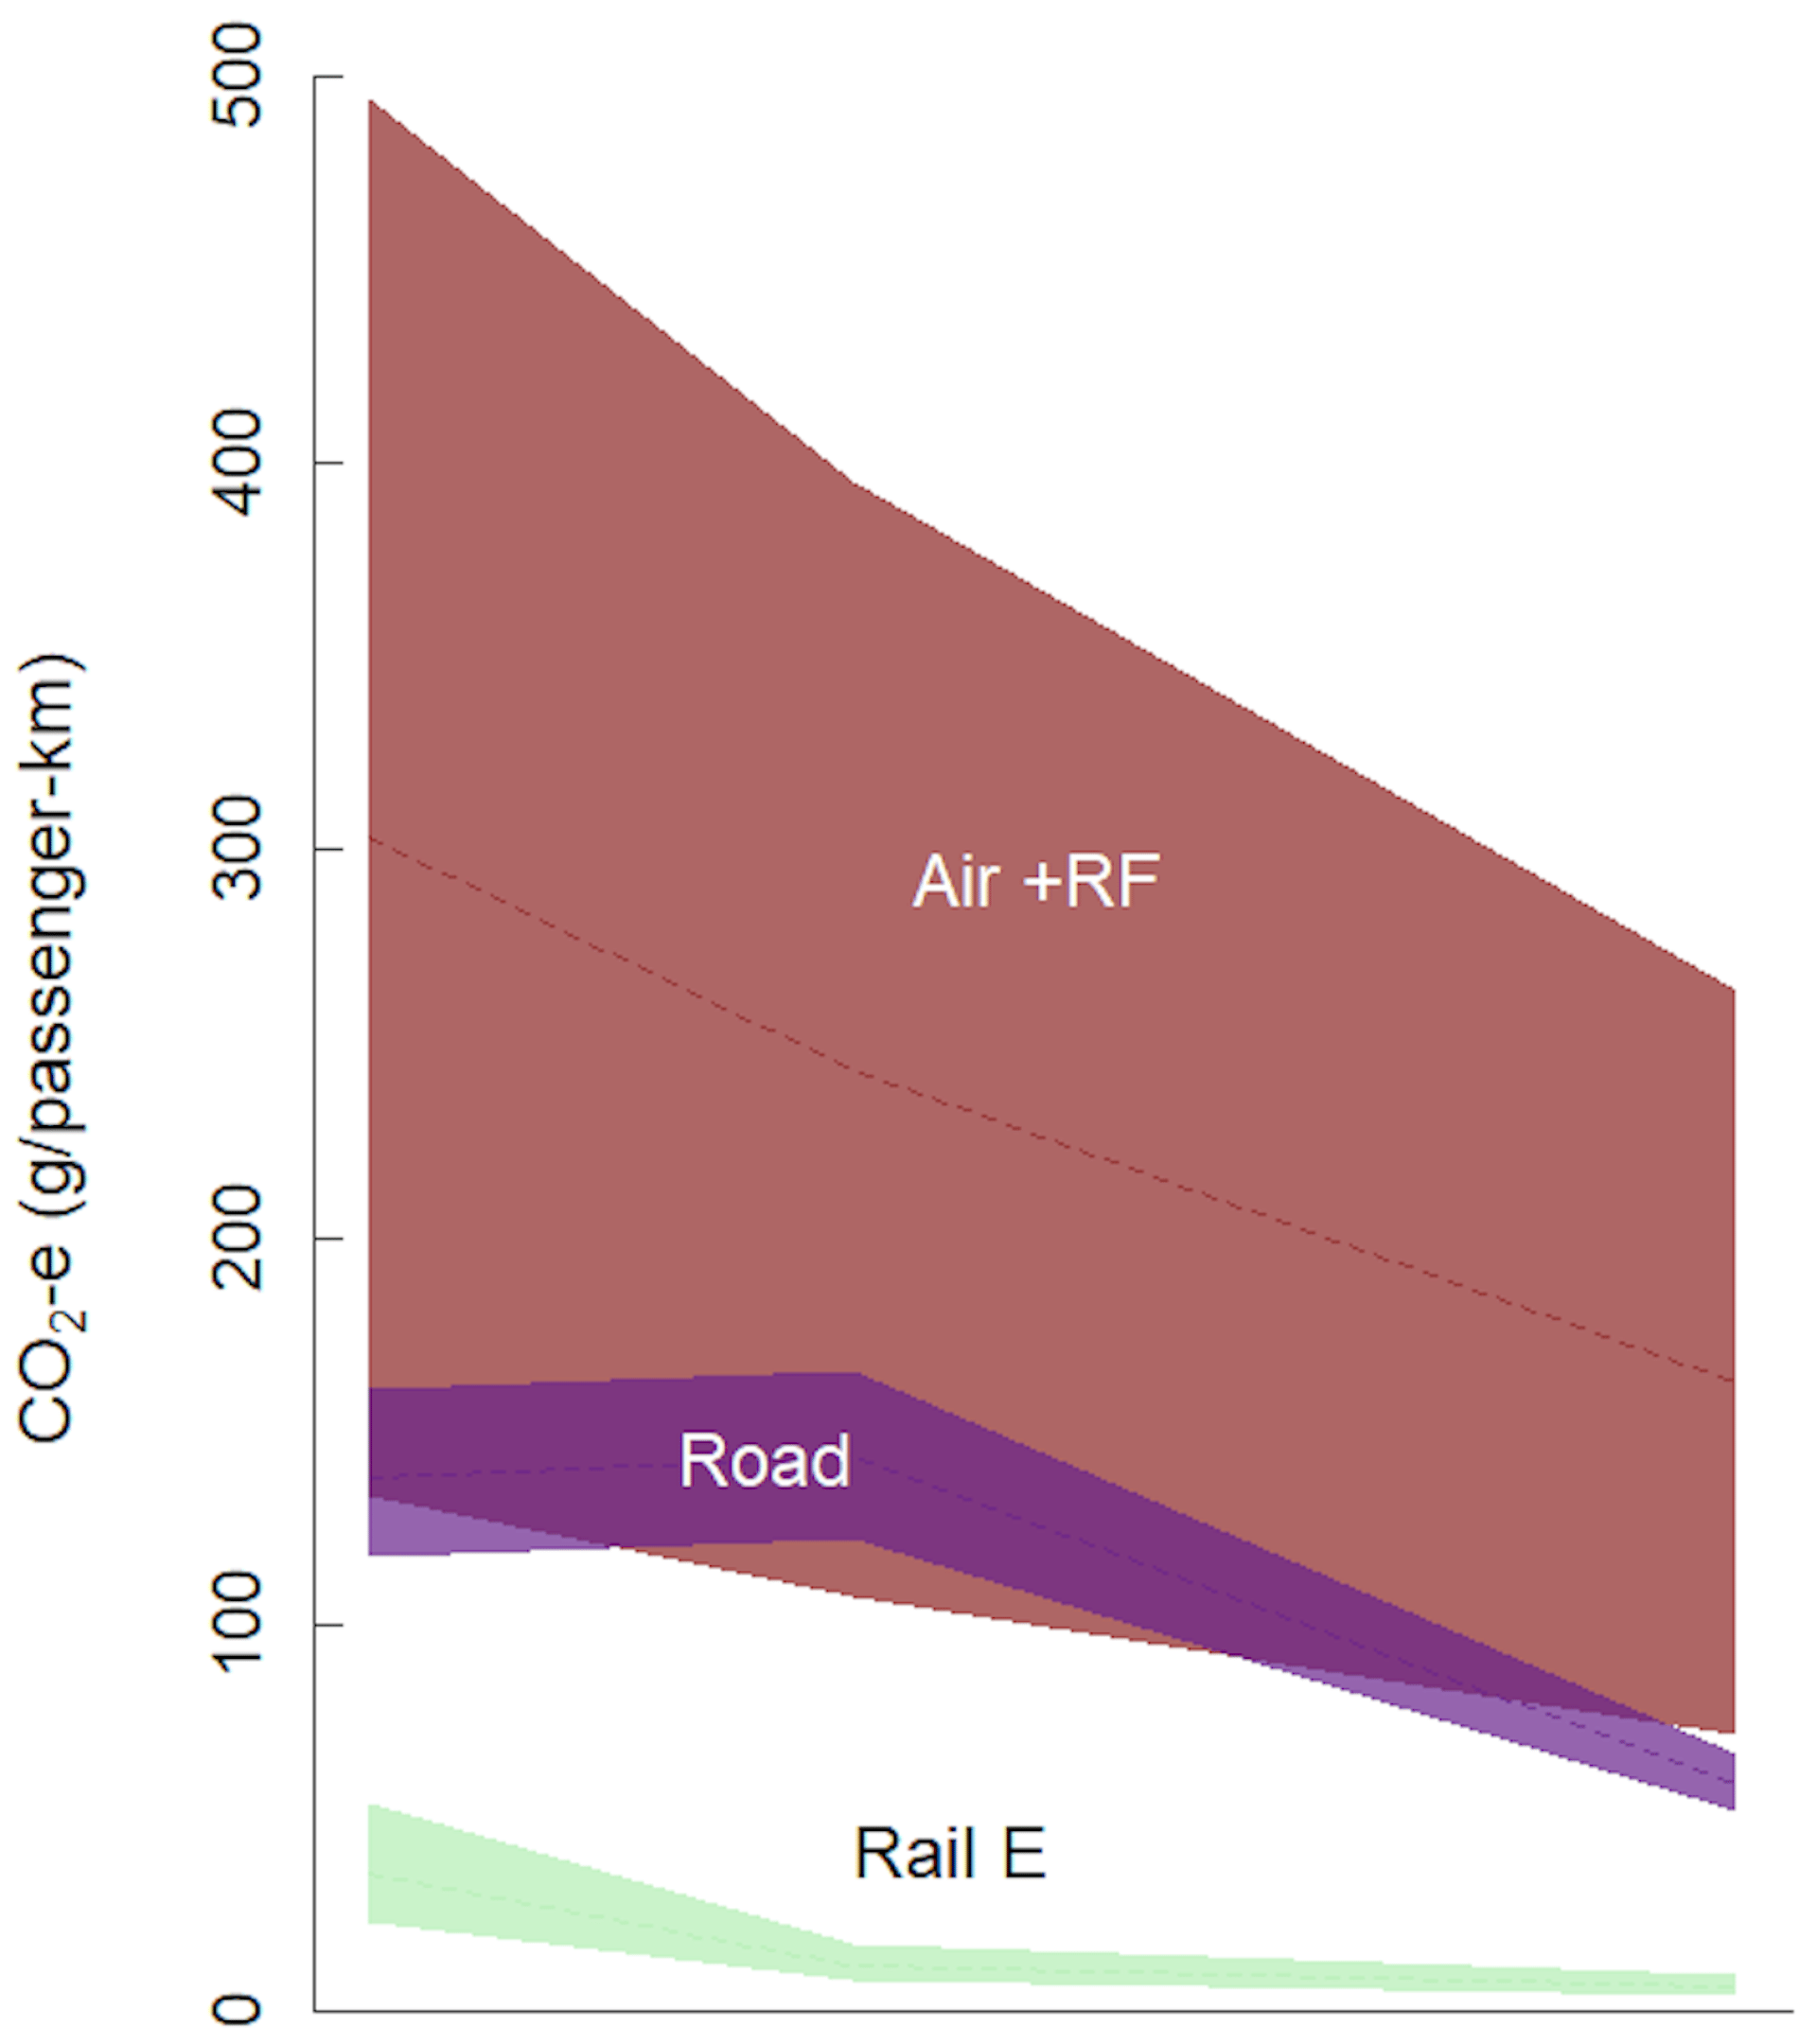
Average well-to-wheel emission intensity for passenger transport. (Dashed line = mean, shading = 99.7% confidence interval, ‘Air’ = aircraft, ‘RF’ = radiative forcing, ‘Rail E’ = electric trains) Author provided, Transport Energy/Emission Research (TER)
For freight in 2019, ships performed much better than any other mode. This included electric rail, due to the relatively high emission intensity of grid electricity at the time. As renewable sources replace fossil fuel generation, electric rail’s emission intensity will improve.
By 2050, bulk carriers and electric rail were estimated to have the lowest emission intensity of all modes. Shifting freight to these modes would deliver deep emission cuts varying from 50–99%.
Air transport performed particularly poorly for moving freight. Its emissions intensity was, on average, 96 to 265 times higher (including the non-CO₂ climate effects of aircraft) than that of electric rail, for instance.
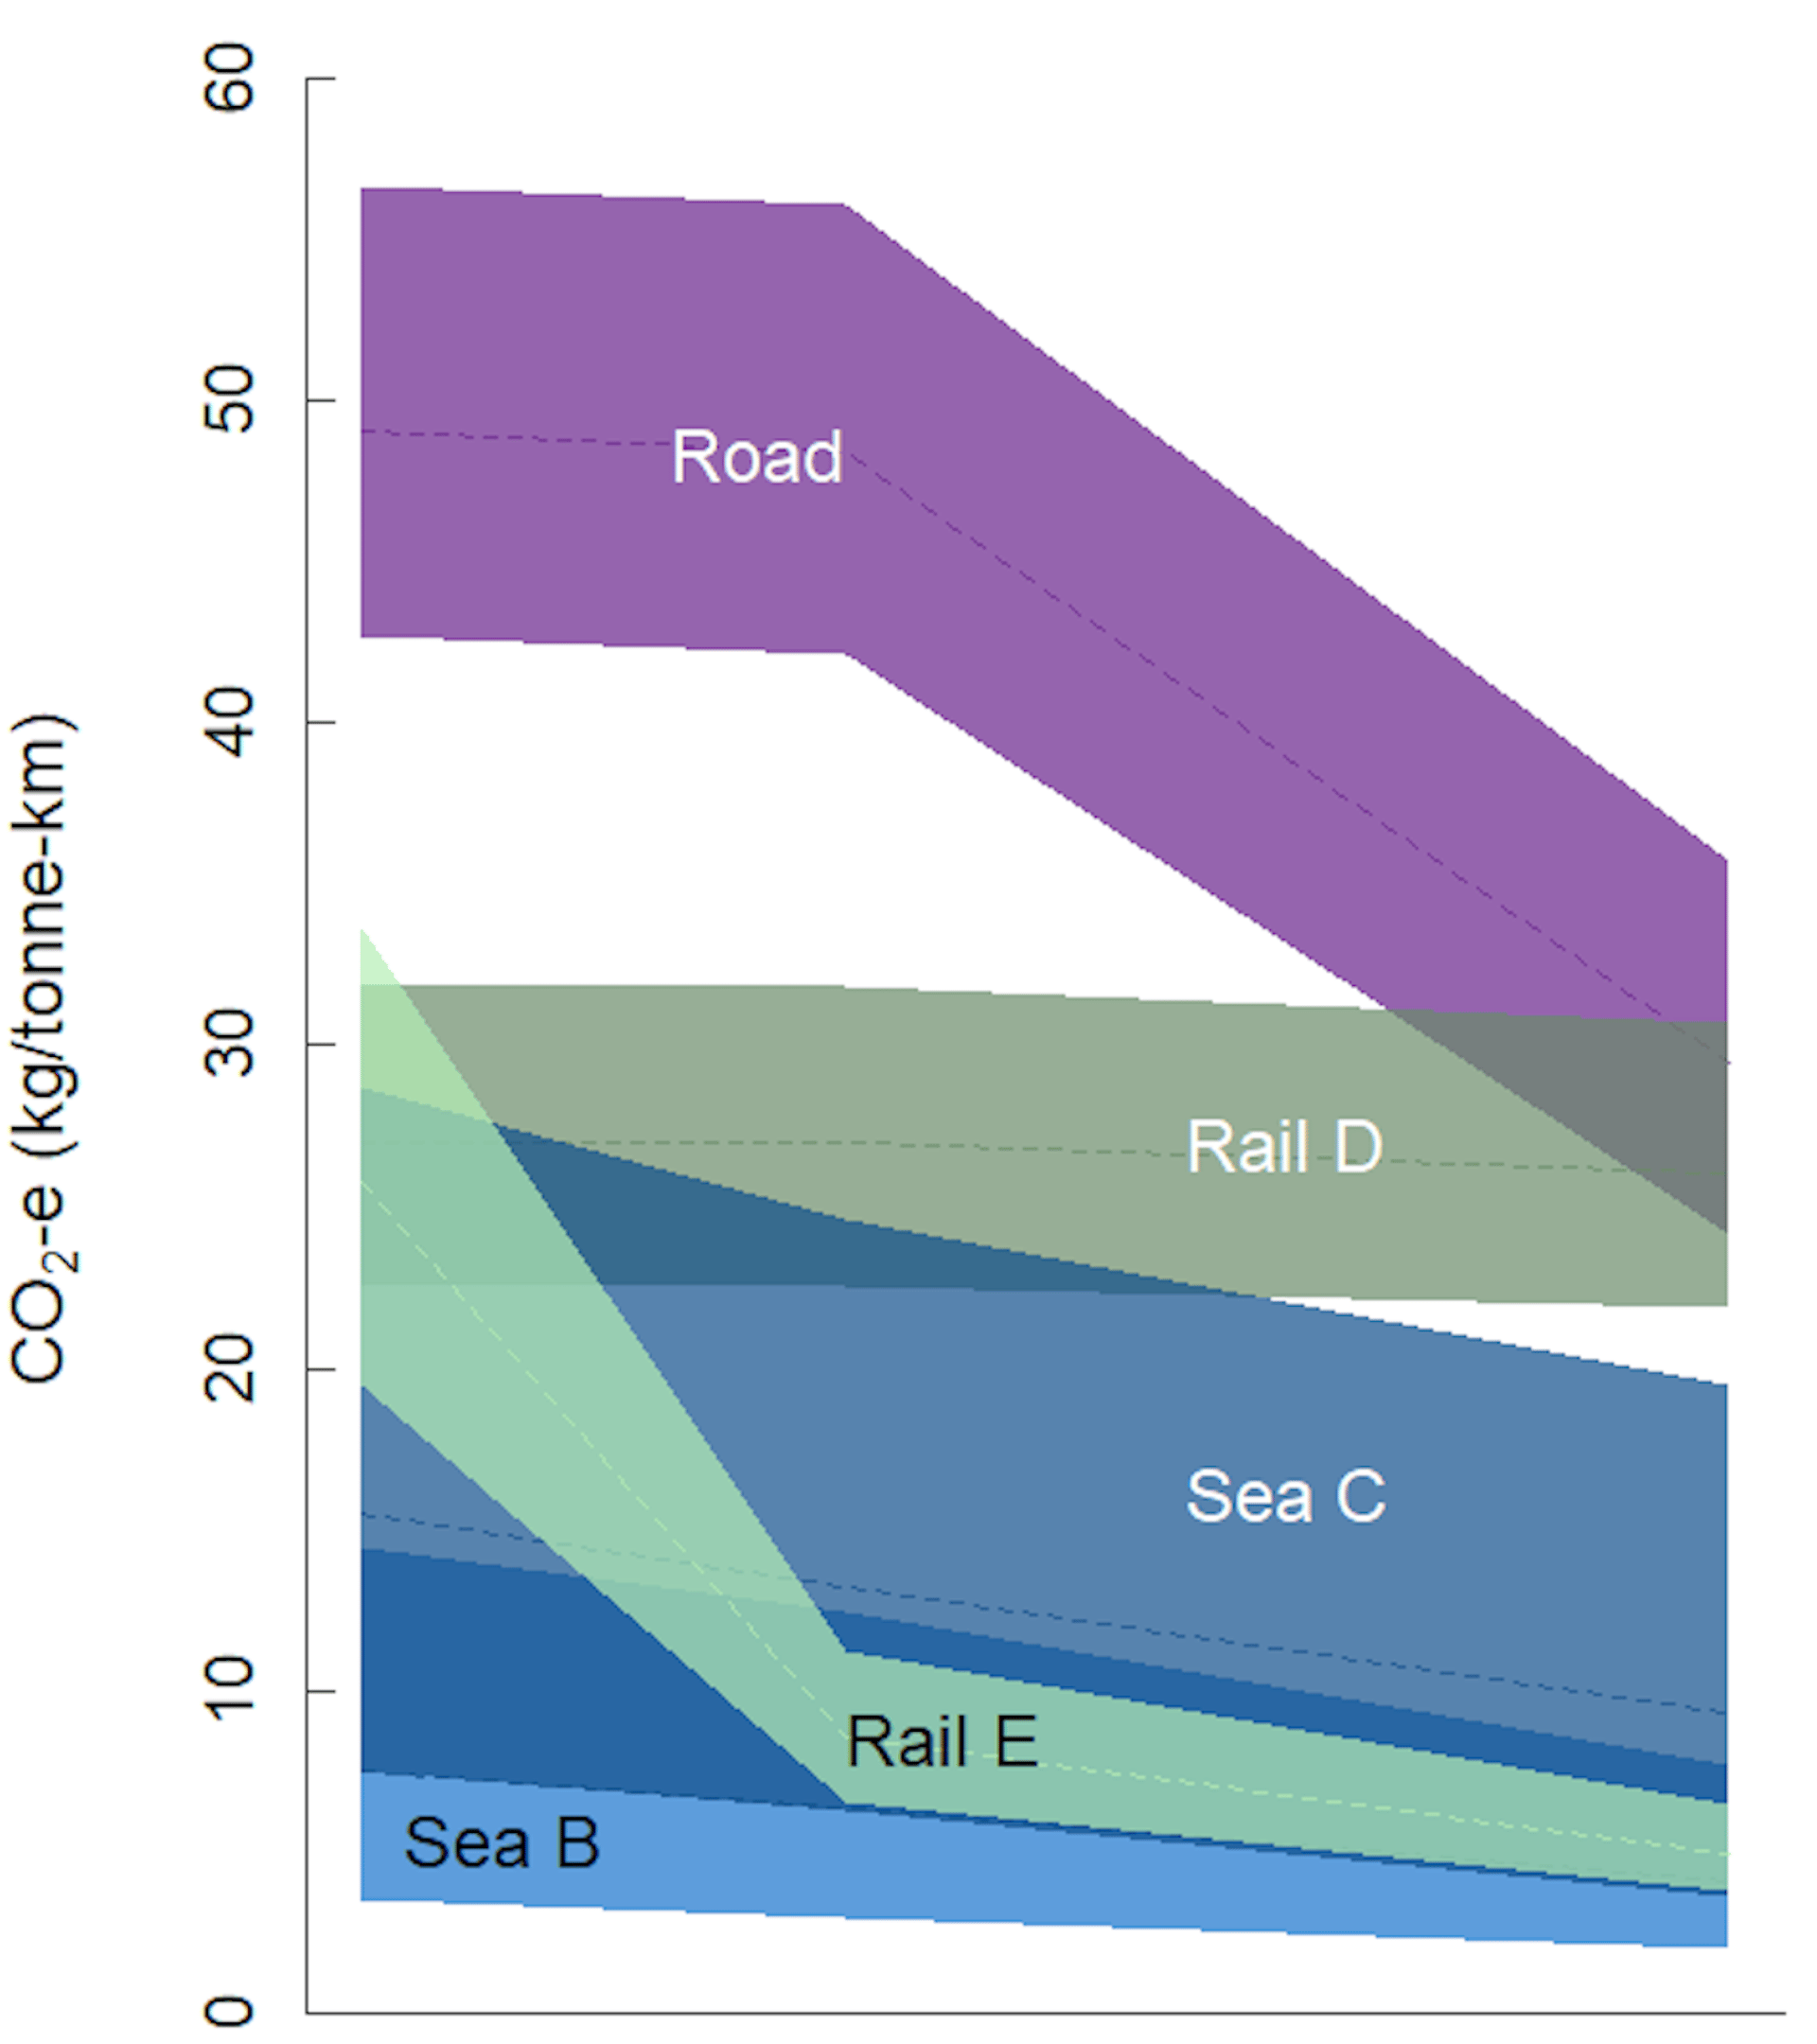
Average well-to-wheel/wake emission intensity for freight transport. (Dashed line = mean, shading = 99.7% confidence interval, ‘Rail D’ = diesel trains, ‘Rail E’ = electric trains, ‘Sea B’ = bulk carriers, ‘Sea C’ = container ships. Please NOTE that aircraft are not included due to the impact of its high emissions on chart readability. Author provided, Transport Energy/Emission Research (TER)
How did the study reach these conclusions?
Modelling the impacts of transport mode shifts on emissions is complex, country-specific and changes over time. It involves a broad range of inputs and information. Each mode has its own challenges and specific details to be considered.
For instance, aviation and shipping operate in the air and water. This means the modelling must account for winds and currents.
As another example, the practice of “slow steaming” – when cargo ships reduce their speed to cut fuel use and emissions – was considered for shipping.
For aircraft, there are additional net radiative forcing effects. (Radiative forcing is a measure of the influence a climatic factor has on the radiant energy impacting Earth’s surface.) These effects are complex and include the formation of contrails (condensation trails), aircraft-induced clouds and ozone formation (secondary air pollutant).
The analysis was based on statistical modelling. That is, instead of estimating single emission values, we quantified the most likely value and a plausible range in emissions performance.
It is also very important that the estimates reflect Australian conditions. For instance, we specifically modelled emissions from ship types and sizes (bulk carrier and container ships) and aircraft (A320 and B737) commonly used in Australia.
The modelling included mode-specific aspects such as vehicle weight and capacity, passenger occupancy, payload, annual passenger and freight volumes, operational profiles, future efficiency improvements and travel distance.
Travel distance can be surprisingly different between modes, as the map below shows. Air transport generally has the smallest travel distance. Sea transport routes can be much longer (about 60%).
What does this mean for policy and people?
Mode shift from road and air to rail and shipping has unused potential in Australia. Our findings suggests governments should, where possible, promote this shift for environmental and climate change reasons.
Clearly, other aspects such as costs and practical barriers need to be considered. But, from an emissions perspective, mode shift could get the Australian transport sector much closer to net zero.
And, as individuals, we can often reduce our own impacts by choosing not to travel or using lower-emission transport modes for our personal travel and the products we buy.
Robin Smit, Adjunct Professor, School of Civil and Environmental Engineering, University of Technology Sydney
This article is republished from The Conversation under a Creative Commons license. Read the original article.