Transport emissions have grown in line with the population and economy. Without intervention, the Australian government expects transport to be the largest emissions source by 2030. So, cutting transport emissions is a crucial, but challenging, element of the net-zero strategy.
Independent research estimated Australia would cut road transport emissions by only 35-45% from 2019 to 2050. This is due to a projected increase in travel, a sustained rise in sales of large passenger vehicles (SUVs, utes) and a delayed uptake of electric trucks. It’s clear electrification of the on-road fleet is not going to cut it.
Additional policy measures are thus required in an attempt to meet net zero emissions in 2050 for the transport sector. One such option is mode shift, the shift of passenger and freight travel from high emission modes to lower emission modes.
Our comprehensive study of mode-shift impacts on emissions has been published in two new papers. The first used the Inland Rail project linking Brisbane and Melbourne as a case study of the emissions performance of land-based transport. We examined well-to-wheel emissions (from fuel production, distribution and use) for passenger and freight transport for three years: 2019, 2030 and 2050.
In Australia, we found electric rail is hands down the land transport mode with the lowest emissions intensity (the amount of greenhouse gas produced per kilometre travelled) for both passengers and freight. Compared to road and diesel trains, electric rail could provide deep, fast and robust emission cuts of 80% to 90% from 2030 onwards.
What’s the mix of transport modes in Australia?
The use of different transport modes is highly skewed in Australia.
Domestic passenger travel was 443 billion passenger-kilometres pre-COVID (2018-19). Most of this travel was by road (79%). Only 4% was by rail, with 17% by air.
Domestic freight activity was 785 billion tonne-km pre-COVID (2018-19). Most was by road (28%) and rail (56%). Coastal shipping (15%) made up most of the rest. Air freight was less than 0.05% of the total.
What did the study look at?
Modelling of the impacts of transport mode shifts on emissions needs to consider a broad range of inputs and information.
It must also adequately reflect local conditions. We did not identify any recent studies of the effects of mode shift on emissions in Australia. Older studies tended to use data from overseas, which may not be appropriate to assess the Australian situation.
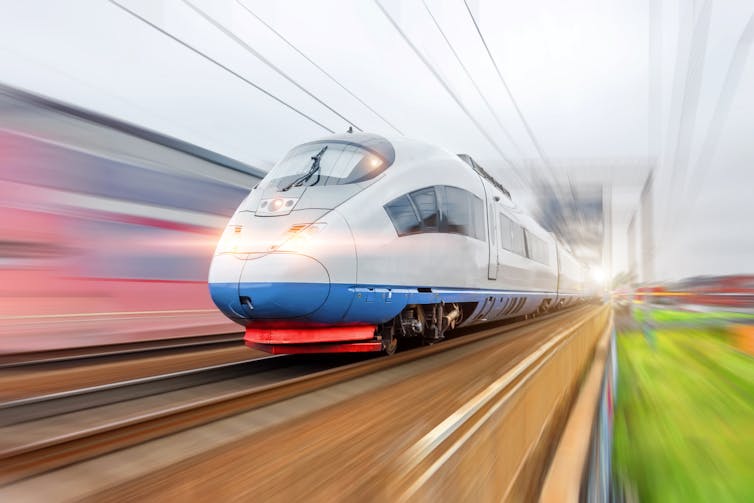
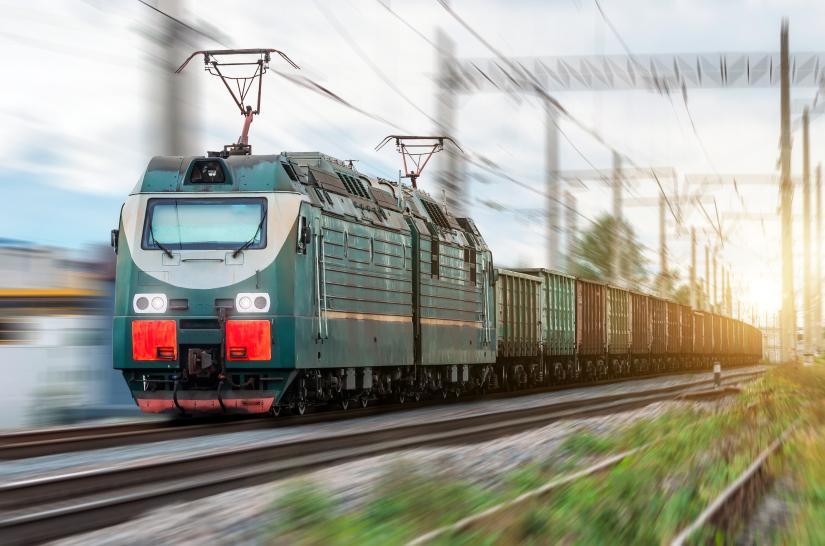
For road transport, we investigated representative Australian passenger vehicles (cars, SUVs) and long-haul trucks (B-doubles), reflecting a power-train technology mix that changes over time. For rail transport we considered both diesel and electric freight trains and a high-speed electric passenger train, noting that these specific electric options are not yet used in Australia.
 The lack of high-speed electric passenger rail trains in Australia is an obstacle to a mode shift from road travel. aappp/Shutterstock
To fairly assess performance, we used the well-to-wheel approach. It includes both direct emissions and indirect emissions from producing and distributing fossil fuels, hydrogen and electricity.
The analysis was based on statistical modelling. That is, instead of estimating single emission values, we quantified the most likely value, as well as a plausible range in emissions performance.
If a distribution is wide (spanning a wide range of possible emission values), there is a lot of uncertainty and variability in the emissions performance. The impact of shifting to this transport mode is less certain.
A narrow distribution means we can be more certain the transport mode will perform as expected. There is less risk of over-promising and under-performing.
It is also very important that the estimates reflect Australian conditions. For instance, we specifically modelled the changing Australian on-road fleet mix and their emissions performance, as well as the emission intensities of the electricity grid. We included various mode-specific aspects such as vehicle weight and capacity, passenger occupancy, freight payload, battery charging losses, hydrogen distribution losses, travel distance and annual passenger and freight volumes.
What did the study find?
Electric rail is the land-based mode with the lowest emission intensity for both passenger and freight transport. Shifting from road to e-rail is estimated to cut emission intensity for passenger transport (grams of CO₂-equivalent per passenger kilometre) by 75% in 2019 and 90% in 2030 and 2050. For freight transport, shifting from road to e-rail cuts emission intensity by an estimated 45% in 2019 and 80% in 2030 and 2050.
All modes improve their emission performance over time. It is clear, though, that the paths to lower emissions are quite different.
Australia is rapidly decarbonising its electricity grid. This immediately affects e-rail emissions. In comparison, the effect on road transport is delayed, due to slow fleet turnover and increasing sales of ever bigger cars and SUVs.
This is an important finding as it means the total cumulative emissions from 2030 to 2050 are estimated to be much lower for electric rail. The level of uncertainty about its performance is also the lowest. This means e-rail would also provide the most robust emission cuts of all modes considered.
The emissions performance of diesel freight trains sits between electric rail and long-haul trucks. It would cut emissions by 45% emission compared to road in 2030. But this difference closes to 10% in 2050 as only marginal improvements are expected for diesel trains over time.
What does this mean for policy?
Mode shift from road to rail has unused potential in Australia, since road transport dominates both passenger travel and non-bulk freight.
This study suggests governments should seriously consider rapidly expanding and electrifying rail from an environmental and climate change perspective. Compared to road, electric rail provides deep, immediate and robust emission cuts of 80% to 90% from 2030 onwards.
Some barriers would need to be overcome to make this a reality. These include steam-age (low speed) railway track alignments and additional travel distances and times due to long and winding routes.![]()
Robin Smit, Adjunct Professor, School of Civil and Environmental Engineering, University of Technology Sydney
This article is republished from The Conversation under a Creative Commons license. Read the original article.


