

- Posted on 23 Feb 2021
- Updated on 23 Feb 2021
- 7-minute read
Meeting the information needs of a new era of decentralised energy.
For this project, ISF partnered with Energy Networks Australia to develop a series of free online maps showing Australia’s electricity network. Called Network Opportunity Maps, they aim to inform the market about locations where investment in demand management and renewable energy may reduce the need to invest in 'poles-and-wires' electrical set-ups. Ultimately, their goal is to support the uptake of local sustainable energy options, and reduce costs for energy consumers.
The challenge
In order for a robust market for demand management or distributed energy to develop in areas where it provides network benefit, it requires clear, consistent and easily accessible data about network constraints, costs and potentially avoidable investments. Without this access to information, the market is unable to invest in a timely, cost-effective manner to support a reduction in traditional network investment.
While electricity network businesses annually report capacity and constraint data, this information is often difficult to interpret for those without specialised skills, or is missing key pieces of information. This information is produced in different formats across the Australian National Electricity Market (NEM) and often lacks sufficient geographical and network support value data to be useful from a decentralised energy project proponent’s perspective.
The solution
The project uses the Dynamic Avoidable Network Cost Evaluation (DANCE) model developed by ISF as part of the. ISF has previously applied the DANCE model for mapping Decentralised Energy for Victoria and for rural areas of the NEM suitable for concentrating solar power.
ISF has developed a streamlined process to collect data provided by the electricity network businesses annually, which is fed into the DANCE model to produce the Network Opportunity Maps on the Australian Renewable Energy Mapping Infrastructure (AREMI) platform.
The maps identify and provide information on areas of network constraint, planned investment and the potential value of decentralised energy resources in networks across the NEM. They:
- identify the most valuable locations to invest in renewable energy and demand management across the grid
- improve the transparency and accessibility of information about development of the electricity grid in a consistent and easily accessible format that was not previously available
- support the community and the emerging market of new energy service providers to better evaluate opportunities to improve the operation of the grid
- help to build the market for demand management
- prepare network businesses and market participants for a new collaborative era of grid management, involving many third party service providers
- help to deliver better value and benefits to all electricity consumers.
Download supporting information
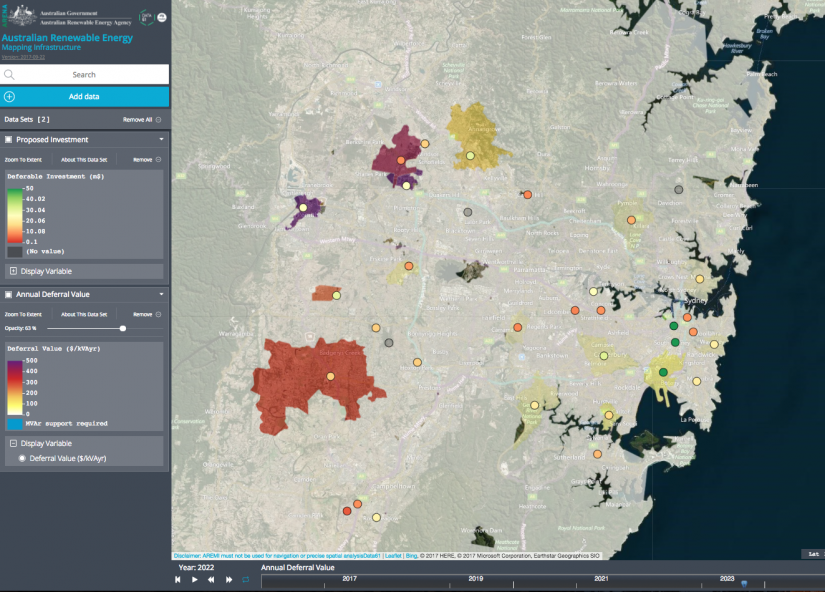
Map of Sydney showing where value could be achieved in deferring network investments.
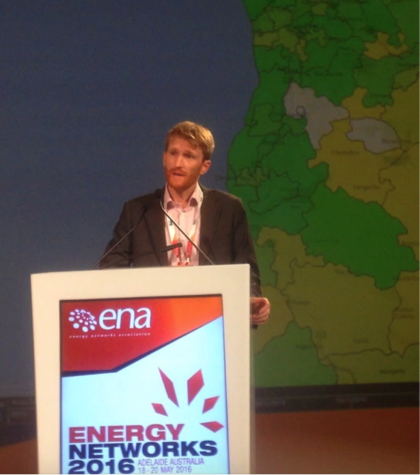
Network Opportunity Maps Project Manager, Ed Langham, presenting about the maps at the Networks 2016 conference in Adelaide.
Data Providers
The maps have been developed in collaboration with all transmission and distribution network businesses in the National Electricity Market, who have generously committed their time and expertise to provide data and refine the maps.
Online host
The mapping data is currently hosted on the AREMI platform by Geoscience Australia, which has been developed with funding support from ARENA, and managed by CSIRO’s digital innovation group, Data61.
Industry map production
As of October 2017, Energy Networks Australia has formally taken over the production of the Network Opportunity Maps from UTS. This arrangement is formalised in a Collaborative Agreement between Energy Networks Australia, UTS and ARENA.
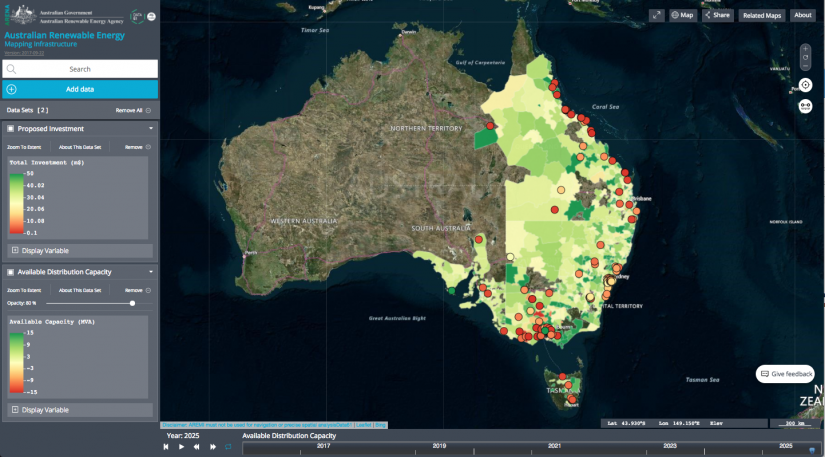
Map of Sydney showing where to expect investment.
Get involved
If you are interested in the Network Opportunity Mapping project, Energy Networks Australia are open to interest and feedback relating to the maps.
To subscribe to the project newsletter mailing list to receive updates about the project and be first to know about public map releases, click here.
RESEARCH OUTPUTS
Launch of the Network Opportunity Maps at the Clean Energy Summit, 27 July 2016 - (Presentation 2016)
Presentation to Energy Networks 2016 - (Presentation 2016)
Project summary - (Report 2016)
Explainer videos:
Layer explainer (15 min)
AREMI tutorial (7 min)
Case Study: Prospecting for New Generation Connections (7 min)
Case Study: Demand Side (6 min)
MEDIA
Media ReleasesNetworks map for a smarter, more decentralised grid (ENA media release), 31 October 2017
National renewable energy map more valuable than ever, (ARENA media release) 27 July 2016
Network Opportunity Maps open window to clean, local energy future, 27 July 2016
New maps identify opportunities for renewable energy investment, 8 October 2015
Government invests in maps of electricity grid to drive renewables investment (Minister for the Environment, media releases) 8 October 2015
Network maps to cut power costs and boost renewable energy, 17 Oct 2014
News storiesNew interactive maps of energy grid, Utility Magazine, 9 January 2019
How to find a site for a solar farm in less than 10 minutes, Renew Economy, 1 December 2017
Mapping project reveals renewable opportunities, Utility magazine
Australia invests in interactive maps of electricity grid, Enterpriseinnovation.net, 13 October 2015
Government maps out renewable energy investment opportunities, Business Environment News, 12 October 2015
Renewables mapping tool to boost investment, add value to NEM, Renew Economy, 9 October 2015
New Maps To Help Guide Australian Renewables Investment, Energy Matters, 9 October 2015
The map which shows batteries are a waste of time in NSW and QLD, Business Spectator, 9 October 2015
To-the-point: Australia rolls out renewables investment roadmap, SeeNews Renewables, 8 October 2015
Electricity mapping tool to boost renewable, stop gold-plating, Renew Economy, 5 November 2014
Grid maps to 'boost renewables': ARENA, Climate Spectator, 17 October 2014
Researchers


- Chris Dunstan - Adjunct Associate Professor
- John McKibbin
- Kristian Maras
Contact
To find out more about the project, or to provide feedback on the sample maps, please contact Ed Langham on Edward.Langham@uts.edu.au
Major funder
- Australian Renewable Energy Agency (ARENA)
View more
In-kind support
- ElectraNet
- TransGrid

This project is working towards UN Sustainable Development Goal 11.
Energy; Institute for Sustainable Futures
Partners
- The Australian Renewable Energy Agency (ARENA) provides funding support. The project receives additional funding from NSW Department of Industry, Ergon Energy, UTS, Energy Networks Australia, AusNet Services and Powerlink, and is supported by ElectraNet and TransGrid.
- Data Providers
- The maps have been developed in collaboration with all transmission and distribution network businesses in the National Electricity Market, who have generously committed their time and expertise to provide data and refine the maps.
- Online host
- The mapping data is currently hosted on the AREMI platform by Geoscience Australia, which has been developed with funding support from ARENA, and managed by CSIRO’s digital innovation group, Data61.
- Industry map production
- As of October 2017, Energy Networks Australia has formally taken over the production of the Network Opportunity Maps from UTS. This arrangement is formalised in a Collaborative Agreement between Energy Networks Australia, UTS and ARENA.
- Map of Sydney showing where to expect investment.
- Get involved
- If you are interested in the Network Opportunity Mapping project, Energy Networks Australia are open to interest and feedback relating to the maps.
- To subscribe to the project newsletter mailing list to receive updates about the project and be first to know about public map releases, click here.
Research Centre
Years
- 2014-
Services and capabilities