

- Posted on 17 May 2015
- 2-minute read
1. The annual value of Australia’s goods[1] and services[2] exports to China is $108 billion. This is –
- 2.1 times that to Japan
- 6.7 times that to the U.S.
- 10.5 times that to India
2. The value of Australia’s goods and services exports to China increased by $64 billion in the past five years. Exports to –
- India fell by $8.1 billion
- Japan fell by $4.7 billion
- the U.S. fell by $1.3 billion
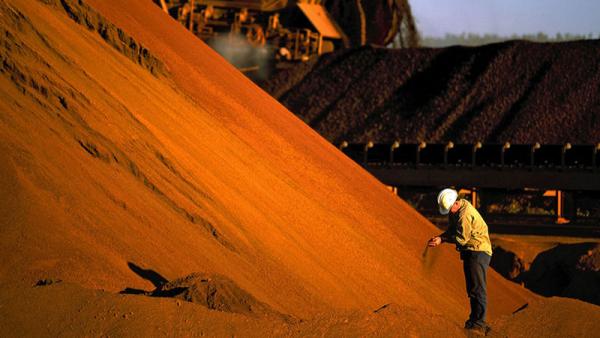
3. The annual value of Australia’s minerals and fuels exports to China is $68.8 billion.[3] This is –
- 2.6 times that to Japan
- 10.8 times that to India
- 464 times that to the U.S.
4. The annual value of Australia’s agricultural exports to China is $9.2 billion.[4] This is –
- 2.1 times that to Japan
- 3.9 times that to the U.S.
- 17 times that to India
5. The annual value of Australia’s manufactured goods exports to China is $4.6 billion.[5] This is –
- On par with that to the U.S.
- 2.5 times that to Japan
- 9 times that to India
6. Education is Australia’s third largest export earner.[6] There are 117,656 Chinese students currently studying in Australia.[7]
This compares with –
- 42,119 from India
- 8,390 from Japan
- 6,265 from the U.S.
7. Tourism is Australia’s sixth larger export earner.[8] There have been 759,800 visitor arrivals from China in the past year.[9]
This compares with –
- 528,100 from the U.S.
- 324,800 from Japan
- 184,900 from India
8. The annual value of net Chinese investment in Australia is $8.8 billion.[10] This compares with –
- $0.12 billion from India
- $6.6 billion from Japan
- $31.7 billion from the U.S.
Endnotes
[1] As of June 2014. Source – Australian Bureau of Statistics (ABS)
[2] As of year-end 2013. Source – Department of Foreign Affairs and Trade (DFAT)
[3] The figure is for 2013. Source – DFAT
[4] The figure is for 2013. Source – DFAT
[5] As of year-end 2013. Source – DFAT
[6] As of year-end 2013. Source – DFAT
[7] As of June 2014. Source – Australia Education International
[8] As of year-end 2013. Source – DFAT
[9] As of June 2014. Source – Tourism Australia
[10] The figure is for 2013. Source – ABS